The Australian Bureau of Statistics (ABS) released the latest labour force data today (July 23,…
Australian labour market – government austerity bias deliberately elevating wastage
The Australian Bureau of Statistics released the latest data today – Labour Force, Australia, July 2019 – which reveals a labour market with where employment growth is not strong enough to absorb the increasing labour force as participation continues to creep up. As a result, unemployment rose again, albeit modestly. The disturbing trend in this rather weak environment is that underemployment rose by 0.2 points) to 8.4 per cent further and the total labour underutilisation rate (unemployment plus underemployment) rose as a consequence to 13.6 per cent. Both the unemployment and underemployment rates are persisting around these elevated levels of wastage making a mockery of claims by commentators that Australia is close to full employment. The unemployment rate is 7 percentage points above what even the central bank considers to the level where inflationary pressures might be sourced from the labour market. This persistence in labour wastage indicates that the policy settings are to tight (biased to austerity) and deliberately reducing growth and income generation. My overall assessment is the current situation can best be characterised as remaining in a fairly weak state.
The summary ABS Labour Force (seasonally adjusted) estimates for July 2019 are:
- Employment increased 41,100 (0.3 per cent) – full-time employment increased 34,500 and part-time employment increased 6,700.
- Unemployment increased 800 to 712,900 persons.
- The official unemployment rate remained steady at 5.2 per cent.
- The participation rate increased by 0.1 points to 66.1 per cent.
- Aggregate monthly hours worked increased 8.8 million hours (0.5 per cent).
- Underemployment increased 0.2 points to 8.4 per cent (1,143.3 thousand) and the total labour underutilisation rate (unemployment plus underemployment) increased 0.2 points to 13.6 per cent. There were a total of 1,856.2 thousand workers either unemployed or underemployed.
Employment growth positive in July 2019
Employment increased 41,100 (0.004 per cent) – full-time employment increased 34,500 and part-time employment increased 6,700.
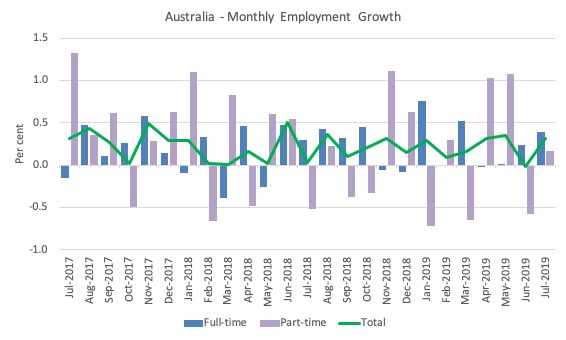
The following graph shows the month by month growth in full-time (blue columns), part-time (grey columns) and total employment (green line) for the 24 months to July 2019 using seasonally adjusted data.
The zig-zag pattern where employment growth has regularly been around zero remains evident.
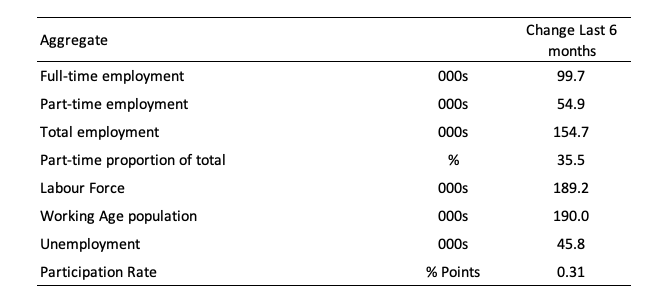
The following table provides an accounting summary of the labour market performance over the last six months. As the monthly data is highly variable, this Table provides a longer view which allows for a better assessment of the trends.
Assessment:
1. Total employment has lagged behind population growth which has resulted in the rise in unemployment.
2. Participation has been rising over the period further pushing unemployment up.
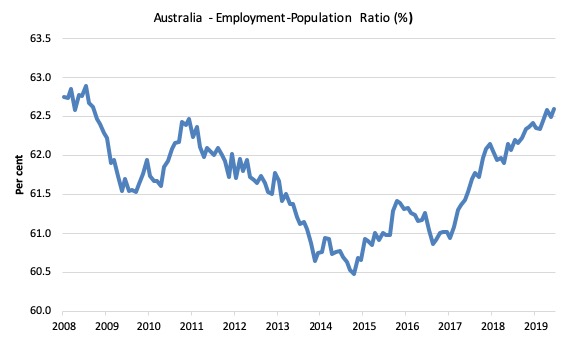
Given the variation in the labour force estimates, it is sometimes useful to examine the Employment-to-Population ratio (%) because the underlying population estimates (denominator) are less cyclical and subject to variation than the labour force estimates. This is an alternative measure of the robustness of activity to the unemployment rate, which is sensitive to those labour force swings.
The following graph shows the Employment-to-Population ratio, since February 2008 (the low-point unemployment rate of the last cycle).
It dived with the onset of the GFC, recovered under the boost provided by the fiscal stimulus packages but then went backwards again as the Federal government imposed fiscal austerity in a hare-brained attempt at achieving a fiscal surplus in 2012.
The ratio rose by 0.1 points in July 2019 to 62.6 per cent and remains below pre-GFC peak in April 2008 of 62.9 per cent.
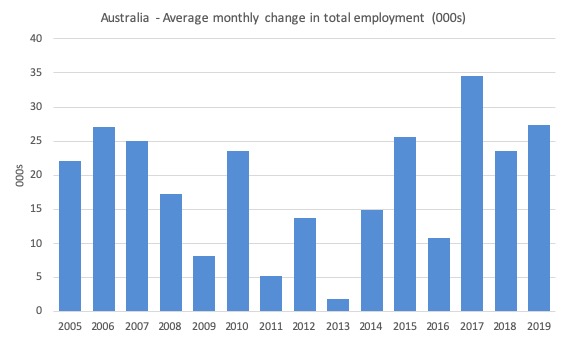
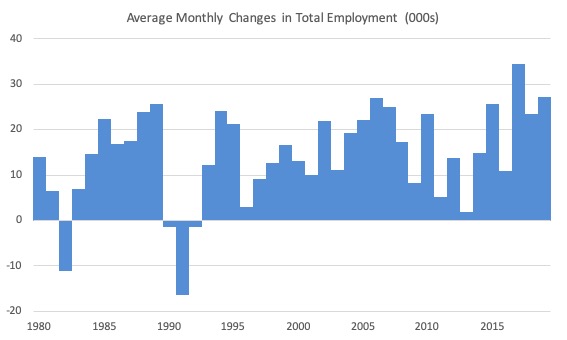
To put the current monthly performance into perspective, the following graph shows the average monthly employment change for the calendar years from 2005 to 2019 (the current year having only 4 observations in the average so far – so caution in interpretation is necessary).
It is clear that after some lean years, 2017 was a much stronger year if total employment is the indicator.
It is also clear that the labour market weakened considerably over 2018.
So far 2019, has been only slightly stronger than 2018.
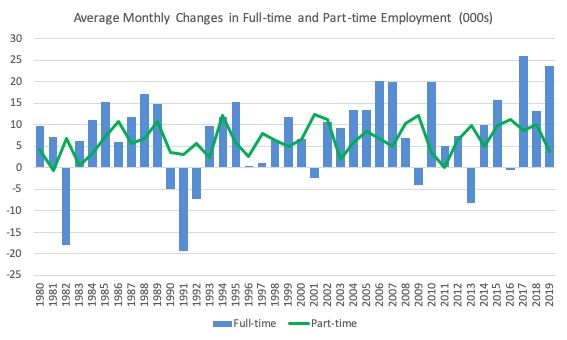
To provide a longer perspective, the following graphs shows the average monthly changes in Total employment (upper panel), and Full-time and Part-time employment (lower panel) in thousands since 1980.
The interesting result is that during recessions or slow-downs, it is full-time employment that takes the bulk of the adjustment. Even when full-time employment growth is negative, part-time employment usually continues to grow.
Unemployment increased 800 to 712,900 persons
The official unemployment rate remained steady at 5.2 per cent.
The policy settings are such (austerity bias) that unemployment is now stuck around this level and well above the level that would be associated with any inflationary impulses being sourced from the labour market
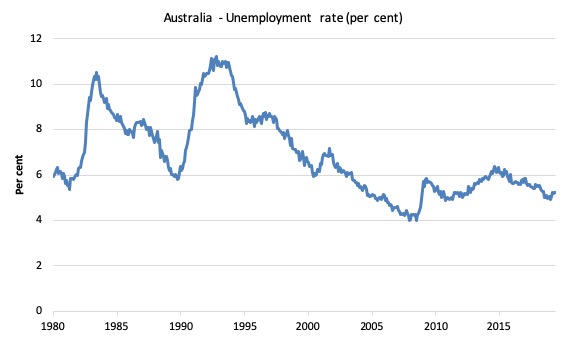
The following graph shows the national unemployment rate from January 1980 to July 2019. The longer time-series helps frame some perspective to what is happening at present.
Assessment:
1. It is still 0.3 points above the level it fell to as a result of the fiscal stimulus (which was withdrawn too early) and 1.3 point above the level reached before the GFC began.
2. There is clearly still considerable slack in the labour market that could be absorbed with fiscal stimulus.
Broad labour underutilisation remained down 0.3 points to 13.4 per cent
The results based on the Monthly data for July 2019 are (seasonally adjusted):
1. Underemployment increased 0.2 points to 8.4 per cent (1,143.3 thousand).
2. The total labour underutilisation rate (unemployment plus underemployment) increased 0.2 points to 13.6 per cent.
3. There were a total of 1,856.2 thousand workers either unemployed or underemployed.
The following graph plots the seasonally-adjusted underemployment rate in Australia from January 1980 to the July 2019 (blue line) and the broad underutilisation rate over the same period (green line).
The difference between the two lines is the unemployment rate.
The three cyclical peaks correspond to the 1982, 1991 recessions and the more recent downturn.
The other difference between now and the two earlier cycles is that the recovery triggered by the fiscal stimulus in 2008-09 did not persist and as soon as the ‘fiscal surplus’ fetish kicked in in 2012, things went backwards very quickly.
The two earlier peaks were sharp but steadily declined. The last peak fell away on the back of the stimulus but turned again when the stimulus was withdrawn.
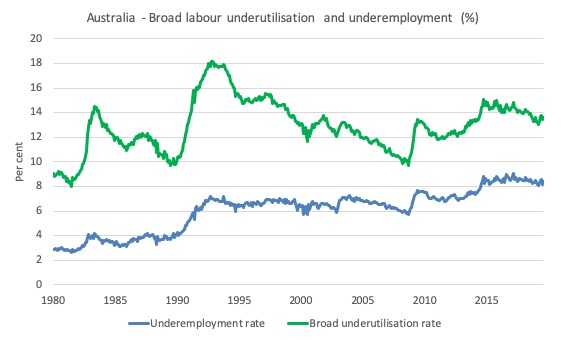
If hidden unemployment (given the depressed participation rate) is added to the broad ABS figure the best-case (conservative) scenario would see a underutilisation rate well above 14.5 per cent at present. Please read my blog post – Australian labour underutilisation rate is at least 13.4 per cent – for more discussion on this point.
Teenage labour market deteriorates further in July 2019
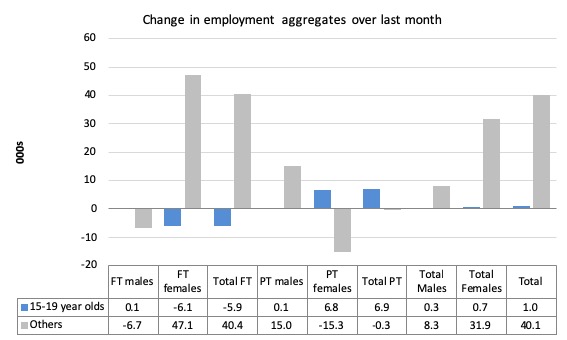
Total teenage net employment rose by 1 thousand in July 2019 but full-time teenage employment fell by 5.9 thousand.
This was offset by part-time work, which rose by 6.9 thousand.
The following graph shows the distribution of net employment creation in the last month by full-time/part-time status and age/gender category (15-19 year olds and the rest)
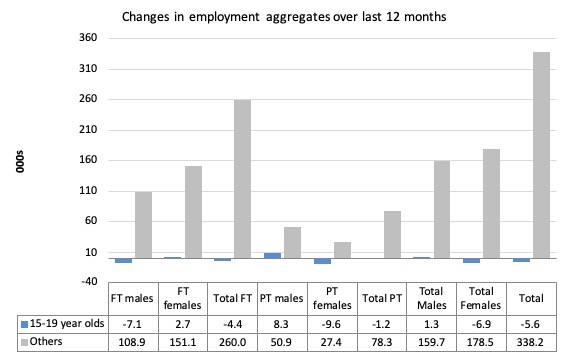
Over the last 12 months, teenagers have lost 5.6 thousand (net) jobs overall while the rest of the labour force have gained 338.2 thousand net jobs.
The following graph shows the change in aggregates over the last 12 months.
In terms of the current cycle, which began after the last low-point unemployment rate month (February 2008), the following results are relevant:
1. Since February 2008, there have been 2,260.6 thousand (net) jobs added to the Australian economy but teenagers have lost 67.4 thousand over the same period.
2. Since February 2008, teenagers have lost 102.9 thousand full-time jobs (net).
3. Even in the traditionally, concentrated teenage segment – part-time employment, teenagers have gained only 35.5 thousand jobs (net) even though 1068.9 thousand part-time jobs have been added overall.
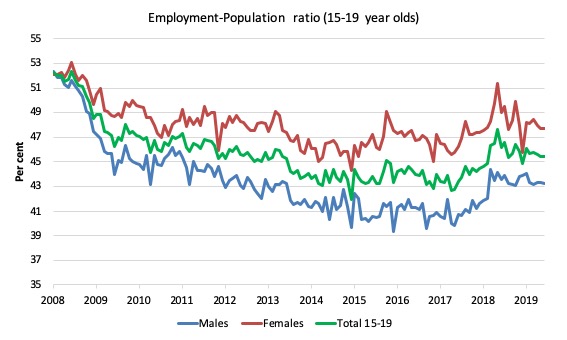
To put the teenage employment situation in a scale context (relative to their size in the population) the following graph shows the Employment-Population ratios for males, females and total 15-19 year olds since February 2008.
You can interpret this graph as depicting the loss of employment relative to the underlying population of each cohort. We would expect (at least) that this ratio should be constant if not rising somewhat (depending on school participation rates).
The absolute loss of jobs reported above has impacted more on males than females.
The male ratio has fallen by 9.1 percentage points since February 2008, the female ratio has fallen by 4.4 percentage points and the overall teenage employment-population ratio has fallen by 6.8 percentage points.
The other statistic relating to the teenage labour market that is worth highlighting is the decline in the participation rate since the beginning of 2008 when it peaked in February at 61.4 per cent.
In July 2019, the participation rate was 54.7 per cent (down 5 points on the previous month). This is a very unreliable statistic overall – it fluctuates widely on a monthly basis.
However, the difference between the 2008 level, amounts to an additional 91.7 thousand teenagers who have dropped out of the labour force as a result of the weak conditions since the crisis.
If we added them back into the labour force the teenage unemployment rate would be 25.3 per cent rather than the official estimate for July 2019 of 16.9 per cent.
Some may have decided to return to full-time education and abandoned their plans to work. But the data suggests the official unemployment rate is significantly understating the actual situation that teenagers face in the Australian labour market.
Overall, the performance of the teenage labour market leaves a lot to be desired. The decline in full-time employment for teenagers was particularly worrying.
This situation doesn’t rate much priority in the policy debate, which is surprising given that this is our future workforce in an ageing population. Future productivity growth will determine whether the ageing population enjoys a higher standard of living than now or goes backwards.
I continue to recommend that the Australian government immediately announce a major public sector job creation program aimed at employing all the unemployed 15-19 year olds, who are not in full-time education or a credible apprenticeship program.
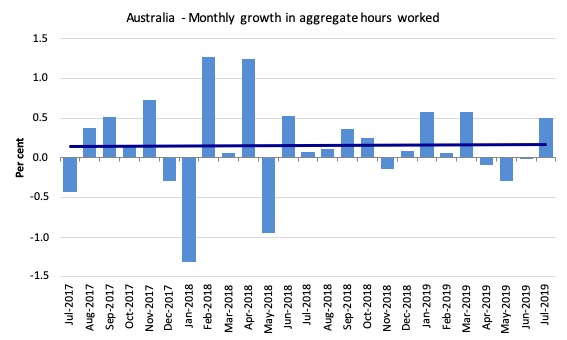
Hours worked increased 8.8 million hours (0.5 per cent) in July 2019
The following graph shows the monthly growth (in per cent) over the last 24 months.
The dark linear line is a simple regression trend of the monthly change – which depicts a flat trend – distorted somewhat by the outliers.
Conclusion
My standard monthly warning: we always have to be careful interpreting month to month movements given the way the Labour Force Survey is constructed and implemented.
The July data reveals a labour market with where employment growth is not strong enough to absorb the increasing labour force as participation continues to creep up.
As a result, unemployment rose again, albeit modestly.
The disturbing trend in this rather weak environment is that underemployment rose by 0.2 points) to 8.4 per cent further and the total labour underutilisation rate (unemployment plus underemployment) rose as a consequence to 13.6 per cent.
Both the unemployment and underemployment rates are persisting around these elevated levels of wastage making a mockery of claims by commentators that Australia is close to full employment.
The unemployment rate is 7 percentage points above what even the central bank considers to the level where inflationary pressures might be sourced from the labour market.
My overall assessment is:
1. The current situation can best be characterised as remaining in a fairly weak state.
2. The Australian labour market remains a considerable distance from full employment.
3. This persistence in labour wastage indicates that the policy settings are to tight (biased to austerity) and deliberately reducing growth and income generation.
3. There is clear room for some serious policy expansion at present
That is enough for today!
(c) Copyright 2019 William Mitchell. All Rights Reserved.
Another factor in Australia is that we operate with higher current immigration rates than historical rates, so our working population is increasing thus supply of more labour into the labour market generally. Employers can source labour globally on various visa’s often with residency after 3+ years thus further driving down wages but also adding to supply in a slack market. The LNP and also ALP are keen to run the OZ Ponzi economy hard (new people at bottom of pyramid). Total population via immigration and natural increases on top of the base immigration add circa 400K people each year. So with participation rate of 66% the economy needs to add circa 33K jobs per month, just to stand still with unemployment. Using Roy Morgan data compared to ABS data (different collection methodology) the unemployment and underemployment rates are even higher. We are a VERY long way from full employment, although the talking head propaganda agents in the mainstream media will be saying watch for inflation, NAIRU, full employment, skills shortages blah blah.
Damien Boey at Credit Suisse notes employment growth remains far stronger than every economic indicator suggests. There does appear to be something of a disconnect between demand for workers and the demand for the work they produce.
great post.
Time for me to read the macroeconomics textbook to brush up my labor force concepts. I still am not grasping the terms at the level I want.
Bill I tried to access the email address on the information about the MMT u iversity and it came back as
Error Icon
Address not found
Your message wasn’t delivered to //bill.mitchell@mmtuniversity.org because the address couldn’t be found or is unable to receive email.
The response from the remote server was:
550 5.1.1 : Recipient address rejected: User unknown in virtual alias table
@Leftwinghillbillyprospector:
“Damien Boey at Credit Suisse notes employment growth remains far stronger than every economic indicator suggests. There does appear to be something of a disconnect between demand for workers and the demand for the work they produce”.
Interesting point.
Perhaps this raises the issue of ‘value’ as determined only in a neoliberal market place.
‘Effective demand’ for consumer goods – in a neoliberal market – is obviously depressed at present, so the requirement for labour is coming from public service oriented jobs.
In fact, at present a public sector JG is what is required, to boost effective demand in the private market, as well as eliminate underemployment. Note that caring jobs (social and environmental) are not easily “valued” (priced for profit) in a neoliberal market, though of course such ‘caring’ jobs may be valued highly by the community in general.
@Neil Halliday – yes, I think the composition of the jobs growth is what needs to be looked at. The government are still spending up on the NDIS so if there’s disproportionate growth in healthcare areas, that could go some way toward explaining the disjuncture.
This persistent labor wastage is an ongoing scandal of neoliberal regimes — we have to find a way to convince our electorates of the damage it continues to cause.