The Australian Bureau of Statistics (ABS) released the latest labour force data today (June 25,…
Even more evidence that the US labour market is below full employment
Regular readers will know that I have been investigating how close the US is to full employment, given that various commentators and conservative types have been trying to claim it is and that, as a result, the US government should hack into the fiscal deficit and the central bank should raise interest rates. Today, I consider some more evidence of a comparative nature to advance my understanding of the situation. The Bloomberg article (March 29, 2017) – The Jobs Statistics Trump Should Be Worried About – made some good points about the state of the US labour market. It focused on the significant decline in the US labour participation rate since 2000 and the cyclical component of that decline, which is a common trend in many advanced nations and one I have written a lot about in the past. The additional evidence presented in the Bloomberg articles demonstrates that the US economy is still nowhere near full employment. This blog adds some evidence from Australia and Japan by way of comparison.
I last wrote about this topic last week in this blog – More evidence that the US labour market is not at full employment.
In reply to those who think the US labour market is at full employment, the Bloomberg article noted that:
Yes, the unemployment rate is low — and going lower! But the job market still isn’t in great shape, which the unemployment rate misses because it fails to count the millions of people who have given up looking for work.
They proposed two alternative ways of measuring the labour market other than the headline official unemployment rate, which can decline when participation falls, thus sending mixed messages about the state of health.
They said “A better measure to focus on would be the prime-age employment-to-population ratio, or the Hornstein-Kudlyak-Lange Non-Employment Index.”
You can access information about the HKL Index – HERE.
I do not discuss it in any detail here – it is a weighted-aggregate of the various Bureau of Labor Statistics categories (U-1 to U-6) – where the weights vary with the different severity of the non-employment (for example, U-1 is weighted less than U-6)
The Federal Reserve Bank of St Louis (the ‘Fred Blog’) published an interesting article (March 6, 2017) – What is unemployment? – which extends the discussion.
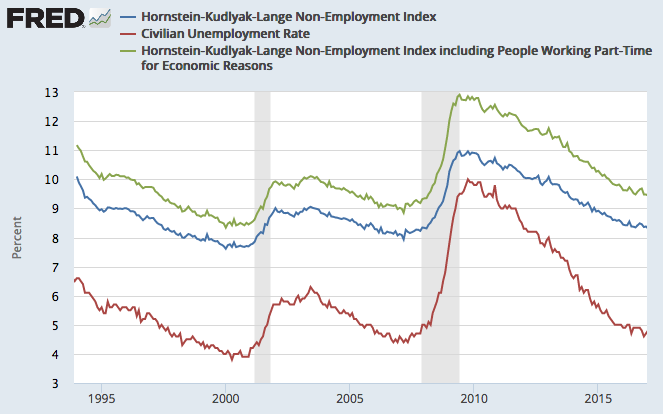
The latest data from the Federal Reserve Bank of Richmond produces the following graph, which compares the HKL Non-Employment Index (in two versions) with the official unemployment rate.
The data shows that while the Non-Employment Index has fallen since the peak associated with the GFC it is still at 8.2 per cent (February 2017). If you add in the underemployment effect (part-time workers forced into that state due to a lack of hours), then the Index is at 9.3 per cent, well above the official unemployment rate of 4.8 per cent.
The index is still well above the troughs of 2008 and 2000, which is a property shared by the official unemployment rate.
So not much support for the ‘full employment’ assertion here.
In this blog, I focus on the other measure – the prime-age employment-to-population ratio, which is the “number of employed people, divided by the number of civilians aged 25 through 54”.
While the female participation rate has been increasing since the mid-1970s, it also started to fall in the US from the early 2000s.
The striking aspect of the decline in US participation has been the increasing number of males dropping out of the labour force.
The reason the prime-age focus is useful is because historically this group has been less impacted by economic cycles and return to work more quickly after a recovery than the other age cohorts.
They are also not impacted as much by the school-to-work transition – participation in education is usually completed. Nor do early retirement trends impact on the ratio.
The prime-age male, in particular, has historically been characterised as the primary ‘bread winner’ for the family structure. Clearly those structures have been changing, with more single-adult households.
But it remains the fact that the prime-age cohort comprise the ‘core’ workforce and so trends in their employment provide strong signals of the strength of the labour market.
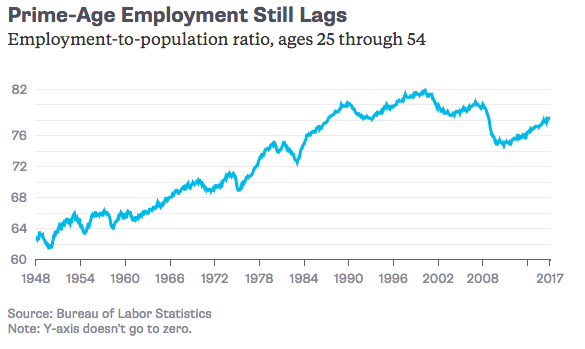
Bloomberg produced the following graphs. The first shows the total prime-age employment ratio, while the second focuses on the male prime-age ratio.
As at February 2017, the total ratio stood at 78.3 per cent well below the January 2000 level of 81.8 per cent and well below the March 2007 value of 80.2 per cent. In November 2009 (at the worst of the GFC) the ratio fell to 75.2 per cent.
Bloomberg note that “there are still a lot more people not working than during the economic expansions of the 2000s, 1990s and 1980s”.
How many more (in thousands)? A simple calculation shows that if the Prime-Age ratio had not have fallen since March 2007 then there would be an additional 2.3 million prime-age workers in employment as at February 2017. Total prime-age employment was 98,371 thousand.
The second graph is useful because “the great wave of women entering the paid workforce swamps almost everything else”.
As Bloomberg note, in “March 1953, only 4 percent of prime-age men didn’t have jobs. In February, that figure was 14.7 percent — which is a lot better than the nearly 20 percent rate at the depths of the last recession but still an awful lot of men without paid work.”
It is true that sociological reasons have meant there are more “stay-at-home dads and very early retirees” but the size of the job losses
March 2007 the ratio was 88 per cent. At the worst of the GFC it had fallen to 80.7 per cent (November 2009). In February 2017, it had only recovered to 85.3 per cent.
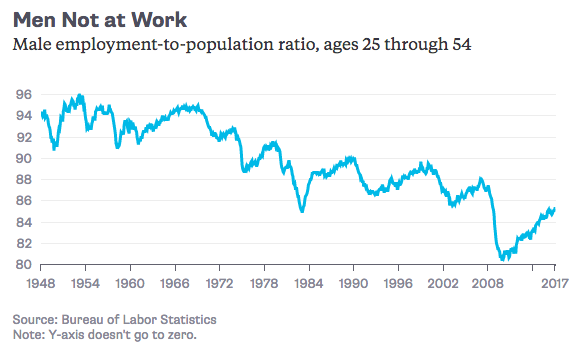
The point is that a lot of prime-age males are without work in the US and it is far-fetched to think that 2.3 million workers have alternative lifestyles that no longer require they work.
International comparison
For interest, I examined the prime-age employment to population ratios for Australia and Japan.
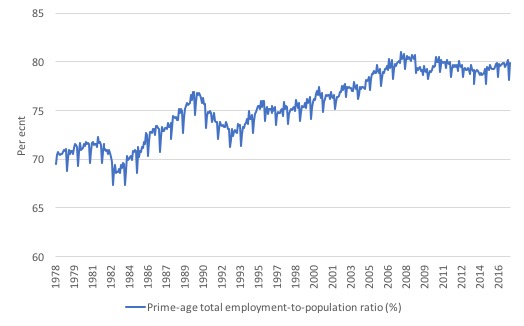
The following graph shows the total ratio (males and females) for Australia (the data is not seasonally-adjusted – hence the squiggles each January when people are on summer holidays).
The ratio fell a little during the GFC period and is still below the pre-GFC peak.
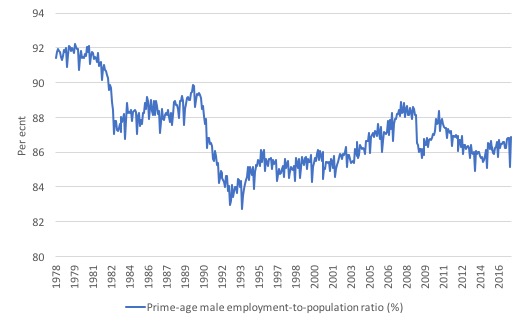
The next graph shows the employment-to-population ratio for prime-age Australian males. I have adjusted the horizontal axis to accord with the US graphs provided by the Bloomberg article.
The pattern for Australia shares some similarities with that of the US and is consistent with the view that the Australian labour market is weak.
But the current level of the prime-age male ratio is still much higher than that found in the US.
Prior to the GFC, the prime-age male ratio peaked at 88.7 per cent (March 2007). It fell initially to 85.7 per cent in June 2009 before the introduction of the fiscal stimulus saw the labour market recover.
The ratio rose back to a peak of 88.4 per cent by December 2010 and was heading back to its pre-GFC peak.
Then the Federal government began its mindless austerity push and the cuts to government spending saw the recovery falter and collapse and prime-age male employment fell to levels not seen at the worst of the GFC.
By February 2017, the ratio was at 86.9 per cent.
The employment difference had the prime-age employment-to-population ratio had have remained at its pre-GFC March 2007 peak measured at February 2017 is 77.8 thousand in a total prime-age male employment pool of 4,295 thousand.
The movements in the ratio since the GFC reflect clearly the benefits of fiscal stimulus and costs of fiscal austerity. Fiscal policy is very effective.
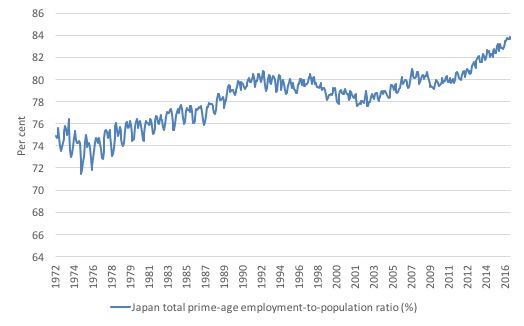
The next graph shows the total prime-age ratio for Japan from July 1973 to January 2017. While the world was crashing during the GFC and the conservatives were running their usual ‘Japanese government will go broke’ story, the Japanese prime-age male ratio barely blinked and recovered quickly.
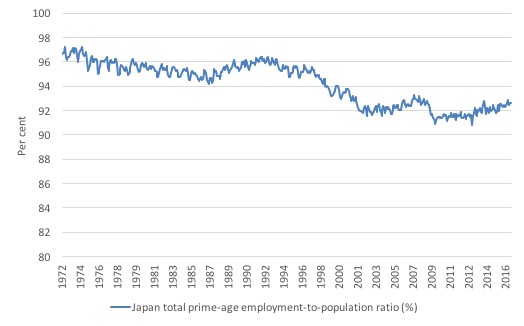
The next graph is for prime-age Japanese males. The vertical scale is the same as the Bloomberg graph for US males. In July 1972, the US prime-age male ratio was 92.3 per cent and the Japanese ratio was 96.6 per cent
The male Japanese ratio has fallen somewhat over the period shown and was 92.6 per cent in January 2017 compared to the US value in the same month of around 85.2 per cent.
It is more evidence that despite the ‘lost two decades’ in Japan, its labour market has held up much better than the Western economies.
Conclusion
I will write more about Japan in the coming weeks. All the stories about ‘lost decades’ are used to vilify activist fiscal policy in Japan.
The reality is quite different. Its labour market has been very resilient and the fiscal support given to employment has been very successful.
The US labour market is quite different and has generated much poorer responses in recent decades.
And … it is still a long way from full employment.
The lying and incompetent federal government
I thought this should be documented.
Australia has an annual minimum wage review held by a judicial body, the Fair Work Commission. In June (usually) it makes its decision and sets the minimum wage for the year ahead after taking evidence from all and sundry.
The unions want a significant rise, which is justified given that the growth in the minimum wage has fallen behind general wages growth (which, itself, has been very weak).
Last year’s decision, provided for a very small real wage increase but largely maintained the gap between the low paid workers and other wage and salary recipients, who themselves are suffering a major wages squeeze as corporate profits rise.
The decision also continued to deny minimum wage earners access to the national productivity growth that had occurred over the previous two years.
Please read my blog – Dirty deals by trade unions and minimum wages in Australia – for more discussion on this point.
The employers groups, as usual, want barely any increase in nominal terms and a cut in real minimum wages because the labour market is weak and their members are struggling. Blaming the weak labour market on wage levels is missing the point altogether that total spending in the economy is weak and being dragged down by poor fiscal policy (a government trying to pursue a fiscal surplus).
Then we get to the Federal government’s submission. The Government has already drowned itself in glory by refusing to intervene in the Fair Work Commission’s decision to cut penalty rates for up to a million of the lowest-paid workers in Australia.
This decision when it becomes operational in July will devastate the weekly incomes of those workers and FWC acknowledged that their lives were already on the edge with current wage levels.
In the – Australian Government Submission – the Federal government urged the FWC to take “a cautious approach” – after claiming that wage rises would “most likely cost jobs” and that:
… increasing the national minimum wage is not an efficient way to address relative living standards or the needs of the low-paid. Low-paid employees are often found in high-income households. The tax-transfer system also provides considerable support to low-income households.
First, when supplemental income support systems are being hacked into in the name of fiscal austerity – impacting on low-wage workers particularly, then wages growth is a key to remaining above the poverty line.
Second, the statement that “Low-paid employees are often found in high-income households” is a sort of snide way of saying that low-wage workers (where females are over-represented) have sugar daddies so there is nothing to worry about?
The Submission repeated this claim on page 4 – “Since many low-paid workers are in households in the top half of the income distribution”.
The evidence presented shows that:
62.4 per cent of low-paid employees are in the bottom five income deciles, with 28.4 per cent in the bottom two deciles. This means that 37.6 per cent are in the top five deciles, with 10.7 per cent in the top two deciles.
But the Federal Employment Minister apparently doesn’t have a clue. She was interviewed this morning on Melbourne Radio (3AW) – here is the transcript (Cash is the Minister, Mitchell the presenter):
CASH: Basically the role of the government when it comes to providing information to the commission on the minimum wage review is to put in contemporary economic information to help the Commission determine what level of increase …
MITCHELL: I understand all that, what do you mean by the low paid workers are often found in high income households?
CASH: Well basically, what we look at is completely all of the information that is provided and what we say to the commission is you need to ensure that you take in to account the economic outlook that in particular, in particular, how we are going to support employers…
MITCHELL: Yes, I understand all that. But what do you mean by…
CASH: … you have high income person in the household…
MITCHELL: Oh dear…
CASH: … but then you’ll often have a second person in the household that doesn’t necessarily earn as much money.
MITCHELL: What’s this line mean, quote “low income workers are often found in high income households”. What does that mean?
CASH: Again, often what it is is that they will have another partner that has a high income but and they are part of the contribution to that household’s income.
MITCHELL: And what percentage of the low income workers are in that position?
CASH: Well as I said there’s only about 200,000 workers that are actually paid at the minimum wage and that is why when you actually look at where the majority of workers lie, the vast majority of people are paid under awards and they actually receive more.
MITCHELL: I understand that, but what percentage of the 200,000 as you say in your submission found in high income households?
CASH: Well, it’s not so much what percentage…
MITCHELL: Well of course it is!
CASH: No no no, because you’ve actually got to look at the minimum wage review in to … to you can’t just literally pick and choose one sentence. So when you look at all of the information that the Government has provided to the minimum wage submission, and again it doesn’t matter who is in power, it’s contemporary economic information.
MITCHELL: Well you tell me. What does it mean “are often found in high-income households”? How many of the 200,000 people struggling along on $17.70 an hour are coming from high-income households, how relevant is the minimum wage in that case?
CASH: Oh look, can I tell you, the minimum wage is absolutely relevant and no one denies that.
MITCHELL: Minister, you don’t have a figure here, do you?
CASH: No, no, no … what is … it’s not that we don’t have a figure Neil…
MITCHELL: You do have a figure? Give it to me!
CASH: It’s very much that you need to look at the minimum wage review as a whole, okay?
MITCHELL: You’ve put this argument that – I agree you’re putting other arguments as well – but you’ve put this argument that many of the people on the lowest wage are actually coming from wealthier households. How many of them?
CASH: OK, OK.
MITCHELL: That’s a simple point, how many, what percentage?
CASH: No, OK, I don’t have the figure, OK, but it’s not as simple as that, as I said, you pick and choose a particular line from the submission and then what you then lose is the totality of what the submission…
MITCHELL: But Minister, please, please, I understand that, I think we all understand that. The point is, in political terms this line from your department, this line from the Government about low-paid workers being found in high-income households is poison. The electorate will look at that and say ‘You elite lot’. I mean, how many of the middle-aged women going and cleaning toilets in hotels today are going hometo a rich sugar daddy?
CASH: No, no, no, please…
MITCHELL: That is what you’re saying here.
CASH: No, no, I really… No, no, no. I do take issue with that because that is not…
MITCHELL: Quote, “are often found in high income households”.
CASH: But again, what you would do, you are taking one sentence and you are distorting the fact.
MITCHELL: Alright, I give up.
That is what goes for a Federal Minister for Employment in our national government these days. Comical yes. Incompetent yes. Should be sacked yes. But then where would we stop …
A dismal outlook.
That is enough for today!
(c) Copyright 2017 William Mitchell. All Rights Reserved.
A dismal outlook indeed with these neocon parasites!
“….as corporate profits rise.”
I have been doing some research on this as I am not sure that corporate profits are in fact rising. I have one graph that shows they have remained more or less flat since 1971. I am saying this because when I was working as an accountant, very few businesses in my client list were earning significant profits (no plcs, mainly self-employed and limited liability). I also had shares in several banks, all of which had lack-lustre share prices and minimal dividends even though they appeared to be making vast profits. Amazingly I got out of them three months before the GFC. More luck than good judgement, and unfortunately I was still invested in property at the witching hour even though I did know about the sub-prime danger. My feeling (with no evidence) is that company revenue is being diverted to CEO and other executive remuneration. But that I have found hard to quantify because it includes things like share options and pensions, the value of which can change over time. This comment is notwithstanding the likes of Google, Microsoft etc.
If anyone has any data on this I would be most interested to see them.
@Nigel,
You say: “If anyone has any data on this I would be most interested to see them.”
Michael Roberts (a Marxist economist) have studied the profit question and, if I remember correctly, his data concur exactly with what you say.
In fact, his thesis is that profit is causally related to investment (profit first, then investment), and that is the lack of profit what produce crisis.
” All the stories about ‘lost decades’ are used to vilify activist fiscal policy in Japan.
The reality is quite different. Its labour market has been very resilient and the fiscal support given to employment has been very successful.”
Not according to Prof. R.A. Werner – an ‘expert’ re Japan?
” . . . (8) Thus record fiscal stimulation in the Japan of the 1990s failed to trigger a significant or lasting recovery, while interest rates continued to decline.
(9) The finding suggests that Japanese fiscal policy has been ineffective during the 1990s (but also the prior and subsequent decades, as tests show), because it was not supported by monetary policy. Ironically, this ineffectiveness finding may provide a strong case for using fiscal expenditure policy as an effective avenue for stimulating the economy, especially in times when bank credit is stagnating – fiscal policy, that is, which is appropriately coordinated with suitable monetary policy. The need for coordination of fiscal and monetary policy has been emphasised previously by economists such as Lerner (1943), Wray (2001), but also Schabert (2004).33 “
Roberto
Thursday, March 30, 2017 at 19:31
Thanks for that.
Nigel you say: ‘very few businesses in my client list were earning significant profits (no plcs, mainly self-employed and limited liability).’ I think maybe even before the GFC there were more just getting by, probably underemployed self-employed than successful entrepreneurs. Certainly since the GFC in the UK, self-employed frequently means underemployed, little income but better than the humiliation, waste of time trips to the job adviser at the job centre. As for limited liability, it’s now common practice for companies to use the owner of the limited liability company to do work with conditions about how and where the work is done, no different than those for an employee.
Corporate profits continue as ever where a monopoly or near monopoly can be created.
Postkey you quote: ‘fiscal policy, that is, which is appropriately coordinated with suitable monetary policy.’ Suitable monetary policy means fixing a suitable interest rate? But the bank interest rate in Japan has been low for a long time. It seems to me that the Prof. Mitchell’s employment graph is a pretty good measure of the comparative success of Japan, though whether this is due to fiscal stimulus or the result of a more sharing/paternal society I don’t know.
Is the question of Japan’s flatlining wages going to be analysed?
It is important we know where the declining wages share has gone.
If it has not gone to employers as a whole than rising wages will generally be
passed on to consumers.
I suspect the financial sector owners of land and relatively few large multi nationals
have had the lions share.
Is it possible that workers in the BRIC nations have had a share of the wages of
the OECD workers?
pardon my stupidity.
then not than.
workers in one country cannot take a share of another nations GDP .