Regular readers will know that I hate the term NAIRU - or Non-Accelerating-Inflation-Rate-of-Unemployment - which…
Ireland demonstrates that fiscal deficits promote growth
On December 10, 2015, the Irish Central Statistics Office (CSO) released the – National Accounts, Quarter 3, 2015 – data, which showed that real GDP had increased by 1.4 per cent over the last quarter while real GNP had declined by 0.8 per cent. On an annual basis, real GDP increased by 6.8 per cent in the September-quarter 2015 and real GN increased by 3.2 per cent over the same period. I’ll discuss the difference between GDP in GNP later but is clear that Ireland is in terms of real economic growth leading the Eurozone at present. In narrow terms, it is also clear that over the last two years the nation has recorded consistent growth. A question that is often asked is whether Ireland defies those who claim that austerity is flawed strategy. I get various E-mails along those lines, some polite, some rude. My answer to the polite ones is that it is difficult to hold out Ireland as an example of austerity-led growth. Ireland is, in fact, a rather strange Eurozone Member State, and is more firmly plugged in to the Anglo world than other Eurozone nations. It just happens, that while the Irish government was suppressing domestic demand through austerity from as early as 2009, significant trading partners (such as, Britain, the US and China) were maintaining expansionary fiscal positions, which allowed Ireland to resume growth. Further, a narrow focus on the growth cycle misses significant aspects of national prosperity. Even with two years of economic growth, real earnings growth is flat to negative, the rate of enforced deprivation remains around 30 per cent, and there is a rising proportion of people at risk of poverty. On top of that, net emigration of skilled workers continues, which means that the official unemployment rate is much lower than it would have been if these workers had not left the country.
The first thing needs to be said is that even after the deepest recession, economies will always begin to grow again. Thus, when Modern Monetary Theory (MMT) proponents argue against imposing harsh fiscal austerity they are not suggesting that eventually growth will return.
Rather, they are arguing that the costs of such a strategy our massive and long-lasting and unnecessary.
Further, there has to be spending for there to be economic growth. In some cases, after a lengthy recession, firms may take advantage of new technologies or new markets and resume investing again. In other cases, external markets might become more buoyant because economic conditions elsewhere are better.
In this blog – Fiscal austerity – the newest fallacy of composition – I argued that if all nations impose fiscal austerity then is difficult for any nation to grow in any short- to medium-term period.
But if one nation is imposing austerity and its principal export markets are in nations that our maintaining expansionary fiscal positions, which are supporting their own growth, then the austerity nation can grow through net exports.
I think it is far-fetched to then claim that in the latter situation the economic growth is due to the austerity. Is quite obvious, that in those circumstances the economic growth is a direct result of the fiscal stimulus applied in the nations that the austerity nation exports into.
It is also clear that Ireland has benefited from this latter situation because it has greater dependence on nations such as Britain, China and the US than other Eurozone Member States, which are more entwined together.
In this blog – Ireland – the quantity-adjusting recovery – I discussed how the Irish recovery was not being driven by price adjustments, but rather, was enjoying quantity adjustments via increased spending.
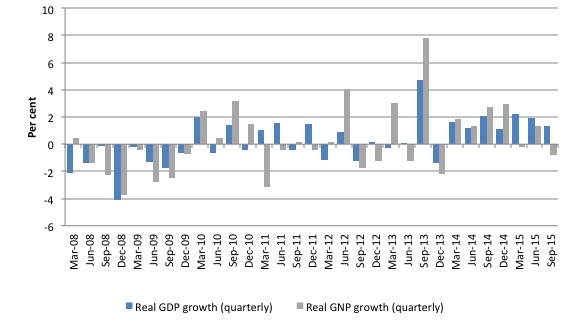
The following graph shows quarterly growth rates in real Gross Domestic Product (GDP) and Gross National Product (GNP) from the first quarter 2008 to the September-quarter 2015.
The pattern of real GDP growth consolidated in the March-quarter 2014 although no consistent pattern for real GNP has been established and growth was negative in the most recent quarter.
First, one needs understand the difference between GDP and GNP. This is a particularly important point when it comes to understanding the Irish predicament (both before the crisis and now).
You can gain a thorough understanding of these concepts from this excellent publication from the Australian Bureau of Statistics – Australian National Accounts: Concepts, Sources and Methods, 2000.
The two concepts are defined as such:
- Gross domestic product (GDP) is defined as the market value of all final goods and services produced in a country in any given period”.
- Gross National Product (GNP) is defined as the market value of all goods and services produced in any given period by labour and property supplied by the residents of a country.
The Irish CSO publication says that GNP = GDP + Net factor income from the rest of the world (NFI). NFI is defined as:
Net factor income from the rest of the world (NFI) is the difference between investment income (interest, profits etc.,) and labour income earned abroad by Irish resident persons and companies (inflows) and similar incomes earned in Ireland by non-residents (outflows).
In this blog – The sick Celtic Tiger getting sicker – I argued that the so-called “Celtic Tiger” growth miracle was an illusion and was driven by major US corporations evading US tax liabilities by exploiting massive tax breaks supplied to them by the Irish government.
A significant portion of the growth in Irish GDP was in fact “profit transfers” to foreign companies (see the New York Times article (May 20, 2010) – Irish Miracle – or Mirage? – by Peter Boone and Simon Johnson).
In relation to the rise in real GNP, the CSO have previously told journalists that the “increase should be treated with caution as it represented profit inflows into Ireland from overseas subsidiaries of companies that had set up headquarters in the country” (Source).
In other words, we cannot interpret that as a bonus for the Irish people (more on this below).
The following graph shows the changes (in millions of Euros) for the June-quarter 2015 and the September-quarter 2015 in real GDP, GNP and NFI. The data tells us that the growth in Ireland in the September-quarter was of no benefit in terms of income flows to the Irish people.
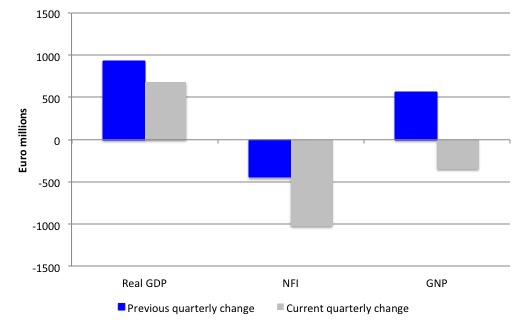
In the third-quarter 2015, Net Factor Income flowing out of Ireland rose substantially – by 13.3 per cent – indicating that the incomes generated by the rising GDP were being significantly captured by foreign companies.
This is why real GNP growth was negative in the September-quarter 2015.
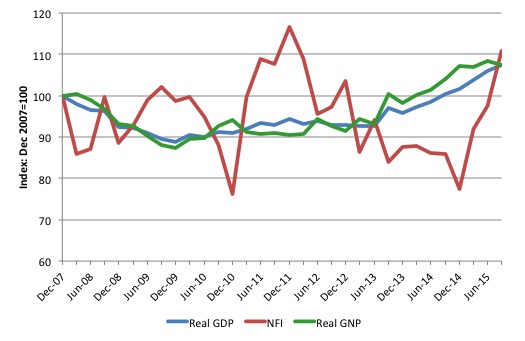
The following graph shows the evolution of real GDP and real GNP (indexed 100 at the December-quarter 2007) and NFI.
The rebound in NFI in the last 12 months has been substantial and suggests a possible return to the pre-crisis situation that was described above – the ‘Celtic gross illusion’.
So that has to be taken into account when we consider the Irish miracle.
Income and Living Conditions – 2014
On November 26, 2015, the CSO released the latest results of the – Survey on Income and Living Conditions (SILC) 2014.
The data shows that:
1. The so-called ‘enforced deprivation’ rate remain unchanged in 2014 at 29 per cent (a statistically insignificant change on the 2013 result). This rate was 17.1 per cent in 2009. In 2007, this rate was 7.9 per cent. That is a spectacular result of the crisis and the growth does not appear to be reducing the deprivation at any reasonable rate.
Enforced deprivation refers to a situation where a person is “unable to afford at least two basics, such as replacing worn out furniture, an evening out, or heating”. Around 1.3 million people in Ireland are in that situation.
2. Over 440,000 of those in enforced deprivation are children, and about 85,000 are pensioners.
3. The Survey also showed that the ‘at risk of poverty’ rate had risen in 2014 to 16.3 per cent, up from 15.2 per cent in 2013. Poverty is rising among children and pensioners as well as among people with disability and carers. Since 2011, an extra 55,000 people have entered the ranks of the poverty (now standing at around 750,000).
A commentator from Social Justice Ireland said (Source:
These figures provide conclusive evidence that, despite what we are being told, Government policy has failed to protect our society’s most vulnerable, or to significantly ease their difficult circumstances.
Government did have choices. The choices it made produced five regressive budgets in a row which has resulted in 1.3m people experiencing deprivation and three quarters of a million people living in poverty.
In what sense can we say a nation’s recovery when poverty is increasing.
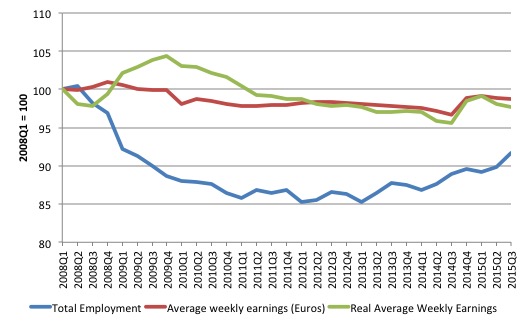
The following graph provide some clue to why the real GDP growth has been associated with reduced poverty rates. It shows employment, average weekly earnings (in Euros) and real average weekly earnings, all indexed to 100 in the March-quarter 2008.
Total employment is still some 8% below the level reached at the onset of the crisis. Real average weekly earnings are also below the pre-crisis levels, although they have shown remarkable stability.
Is quite clear that the workers are not sharing proportionally in the real growth at present.
Net Emigration remains positive – a skill drain
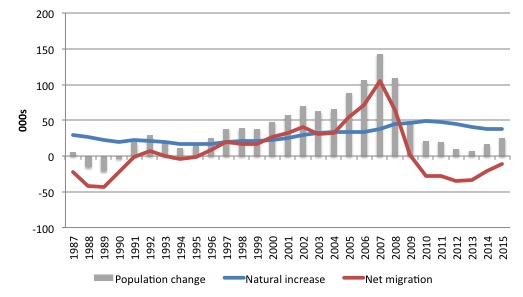
During the crisis, the growth rate in the Irish population shrank dramatically and net emigration increased. The following graph taken from the official CSO data shows the annual population change (000s), the natural increase component and the net migration component.
Prior to the GFC, the Irish population grew rapidly as a consequence of positive net migration within rate of natural increase fairly stable.
With the onset of the crisis, net migration plunged and became negative and remains negative today.
But it is the components of the net emigration that is most disturbing. In terms of the age profile the net emigrants are predominantly in the 25 to 44 Prime-age group, which is not surprising given the motivation for leaving Ireland was employment related.
Further, the net emigrants were overwhelmingly Irish citizens rather than foreign nationals.
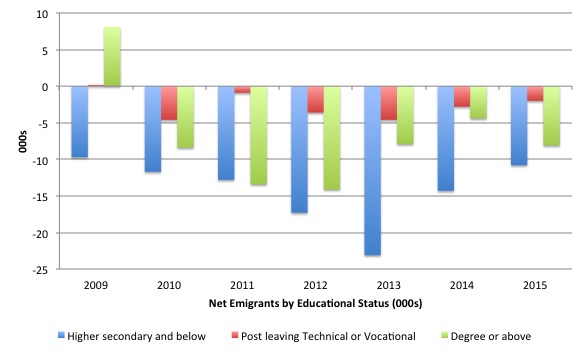
The data also allows us to break down the net emigrants into educational attainment (Source).
The following graph shows the net emigration (000s) by three educational cohorts: (a) Higher secondary and below; (b) posted leaving Technical or Vocational, Advanced Certificate or Diploma; and (c) Third level degree or above, which includes ordinary bachelor degree, professional qualification, honours bachelor degree, postgraduate diploma or degree, and doctorate.
Clearly in terms of numbers the less educated workers a dominant in the net emigrants leaving Ireland.
But the next graph provides more perspective on this. It shows the net emigrants as proportions of the total net emigration between 2010 and 2015. The dotted horizontal lines are the proportion of each educational cohort in the total population as taken from the 2011 Census.
So while in absolute numbers there were more less educated workers leaving the country, these exits in the first years of the crisis were well below what we would have expected based upon their proportions of the total population.
Conversely, in almost each of the years shown the most educated workers demonstrate disproportionately high net emigration rates.
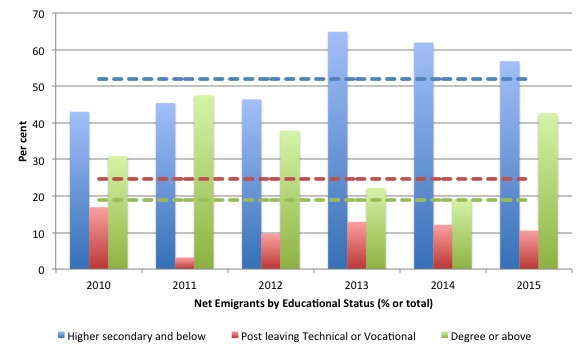
It is quite clear, that Ireland has undergone a skills drain as a consequence of the in during crisis, which will undermine the quality of its future economic performance.
Further, if these workers had not have left Ireland then based upon current employment levels and the age profile of the net emigrants, I estimated that the unemployment rate would be around 10.4 per cent rather than the November 2015 CSO estimate of 8.9 per cent. In other words, the net emigration has made the Irish labour market look better than what it actually is.
Ireland is a different Eurozone nation
If one examines the trade data, it becomes apparent that of all Eurozone countries, Ireland is the only one who trades with non-Eurozone countries more than it trades within the Eurozone. Its largest Eurozone trading partner is Germany and one could hardly say that austerity has been imposed there in the same why that the EU rules have been forced onto other less fortunate Eurozone Member States.
In June 2015, total Eurozone exports amounted to 39.9 per cent of total. Exports by Ireland to fellow Anglo countries (Great Britain, Northern Ireland, Australia, Canada, and are US, amounted to 35.1 per cent of the total. Adding China, India, Japan, Norway, Brazil, Switzerland, Taiwan, and Thailand to the Anglo nations takes that proportion up to 47 per cent of total exports.
The two largest trading partners – the UK and the US – accounts for 32.1 per cent of total exports – and as a result of the ongoing stimulus provided by fiscal deficits in those countries, Ireland has enjoyed buoyant external market accessed.
Things changed for Ireland in 2012 when George Osborne reversed his austerity ambitions in the face of a impending double-dip recession in Britain and talks the foot off the austerity brake.
With the UK currently enjoying increased fiscal deficits that I helping to support on-going growth, despite Osborne’s claiming that he is in fact pursuing a surplus, Ireland will continue to benefit.
I use the term benefit in a narrow sense to refer to capacity to generate positive real GDP growth rates. Is clear that income inequality is rising, poverty rates are rising and unemployment remains at elevated levels.
The point is that these growth markets are demonstrating ‘income effects’ – they are buying more Irish exports because their nations imports are growing as a result of domestic growth. In each of these cases, fiscal deficits remain fairly significant contributors to domestic growth (and import demand).
I could also have shown graphs depicting movements in real exchange rates, which again do not show anything exceptional on the price relative front. Ireland has improved its competitiveness since 2010 but by less than the Euro area as an aggregate and not much more than Germany. This has mostly come from the shift against the US dollar rather than anything Ireland has done by way of internal devaluation.
Conclusion
The evidence is that Ireland’s recovery has been an old-fashioned quantity adjustment aided by its very open economy and access to other growth markets where fiscal deficits have maintained income growth (the US, China, Australia etc).
There is no evidence that the adjustment has come from so-called internal devaluation.
Ireland is not a demonstration that fiscal austerity promotes growth. In fact, quite the opposite.
That is enough for today!
(c) Copyright 2015 William Mitchell. All Rights Reserved.
The Irish are continuing to do what they have been doing since the English colonization so many hundreds of years ago – export their own people,particularly the young and vigorous.
I don’t see that as being a way to build a viable nation but I guess that the native Irish,if they still exist,haven’t been in charge since the marauders from across the Irish Sea took over by force.
Bill
Great insight yet again thanks to your amazing blog anomalies in the neo classical economics that I was taught have been proven as being rubbish. I am a mmt convert trying to increase my knowledge levels which your blog is superb at. I am a kiwi in the uk and look forward to hearing you speak next time you are over. Buying your book today you may get enough commission for a Xmas beer! Merry Xmas, Paul
There is also a Schumpeterian aspect to Irish growth. Tourism is booming (as in Spain and Greece and the Baltic states). It depends a bit on the sector (hotels, transport etc.) but quite often turnover is growing at a double digit rate. This might have to do with (1) the turmoil around the Mediteranean sea and (2) the grey wave, people with plenty of money and no kids at home anymore who love to take trips. Tourism is price sensitive, which is why the VAT increases in Greece are pretty daft.
It is important to note, however, that buoyant growth in a mayor sector of the economy clearly is not enough to blow these economes out of the doldrums. All the sails will have to catch wind.
Some observations from RT in January 2015:
“”With poverty rampant, with over 1.3 million living in deprivation, the Government is playing its tax-cutting fiddle while society burns,” he said.
The political economy expert added private and social housing tenants in Ireland are also suffering serious financial stress.
On Tuesday, during a visit to Ireland, IMF chief Christine Lagarde said the Irish populace were”heros.”
Her assessment related to Ireland’s supposed economic recovery, following a gruelling 4-year TROIKA bailout.”
I’m sure the 30% of those in ‘enforced deprivation’ are fully compensated by the psychological boost of being called ‘heroes’ by Christine Lagarde ( how much more condescending can it get? -Answer: judging by the UK, quite a lot!
A fairly large amount of this growth can be traced to the property bubble in the UK and the soaring current account deficit there.
The necessity for exporting goods or importing income for services in order to limp a little less is simply another indicator that there is a chronic systemic scarcity of domestic individual incomes in every national economy. For some time now Germany and Japan have been able to exploit this in order to bring relative stability to their nations, but globalism is a race to the bottom and soon if not now the only way to maintain such a system will be to export to the moon or Mars. That is unless we supplement individual incomes and reduce prices with a macro-economic discount mechanism. A modern and efficient economy so freed from the slavery of monetary scarcity and the dominating self interests of monopolistic finance would undoubtedly have more employment than the quarter century of stagnation we’re currently heading for and much more general prosperity and leisure as well.