Earlier this week (July 28, 2026), the Governor of the Reserve Bank of Australia presented…
Australian inflation trending down – where are all the gold bugs?
There was a time, in better days, that the evening news had news, sport and weather. Then, at some point, around the 1980s the national news started to host a Finance segment. Sometimes these segments are meagre reporting of what happened in the share markets. Even that benign news is symptomatic of the way neo-liberalism has infested our daily thinking and made the common folk feel part of the game that they are really can never be part of – wealth creation. At other times, the finance segments introduce economic theory and analysis as if it is news. Then the insidious nature of the neo-liberal propaganda machine becomes stark. But the starkness is lost on most because they think it is news and we have been led to believe that what gets pumped out at 19:00 on the national broadcaster (and other times by other broadcasters) are facts. Facts don’t lie do they? Well, when it comes to finance segments they are mostly lies.
On Thursday, two days after the federal budget was released, the finance segment on the ABC evening news provided a graph that purported to show what was at risk if the Australian government didn’t return to surplus as promised.
I cannot show you the graph that was derived from the following graph by the presenter of the ABC finance segment each night. They haven’t, as yet put the segment up on their homepage. But it embellished the above graph by placing a diagonal separation line to form high risk and low risk regions.
While the graph for the TV segment was tarted up by the presenter, it was taken from a report (May 15, 2013) – The 2013-14 Australian Budget – struggling back to surplus – by Shane Oliver who is the AMP Capital’s Chief Economist.
I downloaded the graph, which depicts, spelling errors and all a scatter plot of selected nations with the Gross Public Debt as a percentage of GDP on the horizontal axis and the Budget Deficit as a percentage of GDP on the vertical axis. What such a scatter plot is telling us is anyone’s guess given the bi-directional causality and the cyclical nature of both aggregates. That is just a start though.
The report was part of his regular briefings in his professional role with that financial organisation. Presumably investors read them. Clearly, the presenter of the finance segment on ABC News reads them.
AMP started life as a small-time life insurance company with its agents knocking on household doors during 1950s Australia hoping to flog policies that were rarely of any value to the holders (in NPV terms). But as the financial industry started its massive growth surge, spin-offs like AMP Capital became big in funds management, in particular real estate and infrastructure.
So not only do they fuel asset price booms and participate in major shopping centre developments, where one gets lost for a weekend they are so big, but AMP Capital also is a major player in Public-Private Partnerships, which milk public money for massive private gain. In some specific cases distort public transport systems away from rail (by building toll ways that overcharge given the need for profit).
Anyway, I digress.
The graph was taken directly from Oliver’s 2013-14 Budget analysis, which I filed on my computer under a folder I call “spurious”. This folder contains lots of information that is pumped out into the world as fact but, in fact, is spurious at best.
This blog is, by the way, not a personal attack on Shane Oliver. He is part of the scene – it is the scene I attack.

This is the sort of graph that Rogoff and Reinhardt might have come up with.
The AMP Report provided the following commentary under a heading “The budget deficit – the good and bad”:
Given the coverage around a continuing budget deficit, it is worth putting it into context. First, some background. Just as with a household, a government’s budget deficit is the difference between the amount it spends (on social welfare, defence, infrastructure, health, etc.) and the amount it gets in revenue (from taxes, investment earnings, etc.). It has to be financed by borrowing and to do this, a government issues bonds (to investors such as super funds, insurance companies and foreign investors). The cumulative sum of all such borrowing is its public debt.
I guess from a senior employee of a funds management company that has an interest in fixed-income assets this sort of misleading statement is to be expected.
But the facts are:
1. There is no “just as with a household” when it comes to discussing government spending and revenue. The Australian government issues the currency that the household uses.
These two roles are so fundamentally different that attempts to conflate them in some “accounting” sense is meaningless and misleading.
2. While a budget deficit is the difference between what the federal government spends and what it receives as revenue it does not have “to be financed by borrowing”.
Has is the third person singular present tense of have. In the context used it would mean (Source):
… be obliged or find it necessary to do the specified thing
Here the difference between the essential characteristics of the monetary system in operation and the ideological/political layers that are put over those characteristics become important.
When I say the government does not have to finance its spending it is a recognition of the economic fact that a sovereign government is never revenue constrained because it is the monopoly issuer of the currency.
Note: I confine the term “sovereign” to a currency-issuing government so I am using the term in a monetary sense, rather than as a description of the legal maintainers of some geographic borders. In my usage, Greece or Germany are not sovereign but Australia is.
Under the convertible currency monetary system (gold standard and its variants) the government was obliged as part of the intrinsic characteristics of that system to borrow to fund its net spending. That system largely died in 1971 when President Nixon abandoned US dollar convertibility.
The Euro monetary system shares some characteristics of the convertible system (member states face fixed exchange rates and are unable to issue the currency in use at will).
It is clear that after 1971, governments voluntarily maintained the practice of matching its deficits with some “funding source”. As neo-liberalism gained prominence as an ideology constraining government policy choices, those funding sources were narrowed to private market funds, except, of-course, when it was convenient for governments to suspend that charade and draw on its central bank capacity to create bank credits from thin air (computer data entries into ledgers).
So voluntary is not an obligation. The laws that say that the government has to match deficits with debt-issuance to the private markets are not set in stone. They could be changed in a flash. Even within the current legal framework the government can draw on central bank “funding” if it wanted to.
The “has to borrow” is thus not a binding economic constraint. It is a political issue and people should understand that. When an economist writes that the “government has to borrow” it misleads people into thinking it is an economic statement that is being made.
Further, the accounting charades that might surround such practices – for example, the government might legislate that it has to have the receipts from debt-issuance in a particular account and that account has to be in positive balance before a cheque it spends on can be issued – have no intrinsic relationship to the capacities of the government issuing a fiat currency.
We could easily have an account called “debt sales” standing separate in the books to signal how much non-government sector non-bond financial assets have been converted into non-government sector bond financial assets. Whether that it of interest is a matter of opinion. But that account would have no relevance for the accounts the central bank might keep to record credits its makes into private bank accounts on behalf of the treasury.
Tying the two accounts together and imposing some privileged sequence (money has to be in the debt sales before the credits can be made) is purely voluntary and has nothing to do with the intrinsic characteristics of the monetary system nor economic responsibility or prudence.
When we understand that deficit spending is the only way that net financial assets in the currency of issue can enter the economy then we also understand that the funds the government gets back when it issues a bond came from the government anyway in the form or past deficits – $-for-$.
If people really understood that governments just borrow back their own spending then the financial markets would be seen for what they are in relation to bond market activity – mendicants in receipt of privileged corporate welfare.
Bond issuance is totally unnecessary for the smooth operations of government fiscal policy. There is no essential reason that bond issuance is required for smooth monetary policy.
The central bank can maintain any interest rate target it chooses without open market operations. They are a throwback to the convertible currency system.
The AMP Budget Commentary continued:
While the A$19 billion deficit for this financial year is a lot of money, it needs to be compared to the size of the economy (A$1.5 trillion) to put it into context. This puts it at 1.3% of GDP and as can be seen in the first chart is a big fall from 2.9% of GDP last financial year when the deficit was A$43 billion. This is in fact the biggest reduction in a deficit in modern history. So despite the failure to hit the surplus target (which was always a stretch to achieve anyway) the budget deficit is still going in the right direction.
So context is important. But unfortunately the context provided – size of the overall economy – is also missing the point.
When considering whether a particular budget balance is appropriate it is not the size of the economy that matters. Rather, it is the balance of spending and output capacity, the latter which includes the state of the labour market.
It is the size of the output gap that matters not the absolute size of the economy (measured via GDP).
Would a deficit that was 4 per cent of GDP be worse than one that is only 1.3 per cent of GDP (as is the 2013-14 forward estimate)?
According to the AMP Capital commentary you would conclude the 1.3 is better than the 4. Note the last part of the quote “going in the right direction”.
Why is a movement from a $A43 billion deficit (2.9 per cent of GDP) to a $A19 billion deficit better (1.3 per cent of GDP) a movement in the “right direction”?
Well, it might be an appropriation reduction in government economic impact if the output gap was forecast to close in the coming financial year and unemployment was likely to reach its (low) full employment level.
We know from all the evidence available and even the Treasury’s budget estimates that real GDP will be at least $A60 billion below trend output in 2013-14. We know that unemployment is rising and predicted to rise further in 2013-14.
So if fiscal policy has any purpose one of its primary purposes is to close output gaps, which means the budget is heading in the wrong direction.
What the “biggest reduction in a deficit in modern history” achieved was exactly the opposite to what the neo-liberals said it would achieve. First, it reduced output growth and caused unemployment to rise. Second, in doing so, it undermined its own revenue base and thwarted the Government’s surplus aspirations.
Ken Davidson’s article in the Melbourne Age today (May 20, 2013) – A clever budget? More likely it gives the Coalition room to wind back the welfare state – says that:
… macro-economic policy is concerned about the impact government spending and revenue raising has on the rest of the economy. In a period of uncertainty, when individuals and private business decide to rein in their spending, unless the government steps in to fill the gap, incomes fall and unemployment rises.
Exactly.
His earlier point “that when expenditure is growing faster than the capacity of the economy to produce, governments should run surpluses”, the deficit dove view is, however, flawed and runs contrary to the quote above.
The point is that when expenditure is growing fast than the capacity of the economy to produce the government, if it is happy with the private-public mix in final output, should start reducing its deficit, which is not the same thing as running a surplus.
Whether it should run a surplus or not depends on what the external sector and the private domestic sector is also doing. If there is a very large external surplus (as in the case of Norway), then the private domestic sector can save overall and the government can run a surplus while the economy maintains full employment.
However, that is a special case and cannot apply to all nations because for every $ of external surplus there has to be a $ of external deficit.
In normal times, a nation with a current account deficit (such as Australia) will not be able to achieve strong economic growth, support a desire by the private sector to net save (overall) and run a surplus.
With a current account deficit, a nation can only run a budget surplus if growth is driven by increased private sector indebtedness. That is the way the last government achieved 10 surpluses in 11 years. It was atypical behaviour and, ultimately, unsustainable because the private sector cannot rack up increasing debt levels forever. We are now seeing a return to more typical household saving behaviour and private investment is dropping.
Ken Davidson then said:
… Keynesian economics have always been resisted by neo-liberals because they correctly see Keynesian policies as being consistent with social democratic agendas. The counter-revolution came in the form of the G7 finance ministers meeting in 2010, which agreed to an austerity agenda. This was built around the assumption that the deflationary consequences of cutting government spending and taxes would be more than offset by increased confidence, leading to an upsurge in consumer spending and private investment.
It was a seductive theory for those wedded to a right-wing political agenda involving a winding back of the welfare state, and who resisted the re-regulation of the financial system that precipitated the GFC in the first place.
He says that the neo-liberals promoted the idea that “continuing profligacy involving more deficit budgets would lead ultimately to more Greece-type crises.”
Which is the segue into the next item in the AMP Capital Chief Economist’s assessment of the 2013-14 Federal budget. He wrote:
What’s more, Australia’s budget deficit is tiny compared to other advanced countries. At around 2% of GDP across all levels of government, it compares to around 3% of GDP in the Eurozone, 6% in the US and 10% in Japan.
Similarly, Australia’s gross level of public debt at around 28% of GDP is very small compared to around 95% in the Eurozone, 108% in the US and 245% in Japan.
Which is meant to assuage us. All it does it perpetuate irrelevant assessments – note the comparison between Australia and the Eurozone, for example. At that point the graph above appeared.
Note the summary of the two corner positions – High Risk and Low Risk. We are not exactly told what the risk is but the implicit message is that those nations in the south-west corner are unlikely to become insolvent while those out in the high risk area are vulnerable.
To which a person who really understood this stuff and was being straight would say – nonsense. The graph combines oranges and apples. Certainly, the Eurozone nations are vulnerable to default (Greece has already done so courtesy of the Troika bullying bond holders to take a dive).
And what is Japan doing out there – high risk of what? Note the graph is in terms of Gross Debt. The conservatives always use that instead of net debt because they cannot then put Japan as an outlier. Not, of-course, that either aggregate matters in the ways they claim.
The logic the neo-liberals visit on us is this:
Logic Claim 1. Governments have to issue debt to fund their deficits – which is an untrue statement. They could stop issuing debt today, spend tomorrow and the sky wouldn’t fall in. But then the conservatives wouldn’t have the spurious debt stick to beat them with in order to stop them spending in areas that do not directly benefit the commercial interests of them directly or their mates, who then provide kickbacks to them in a variety of ways.
Logic Claim 2. But governments should have low debt because the bond markets will punish them otherwise so therefore should not spend – unless it benefits the commercial interests of them directly or their mates, who then provide kickbacks to them in a variety of ways.
Of-course, the level of debt a sovereign government has is largely irrelevant to its capacity to increase public welfare via high employment and first-class public services and public infrastructure.
Bond markets cannot “punish” a government via their demand for higher yields because the central bank can maintain whatever yield it wants by offering to by any quantity of public debt at that target.
Bond markets are also hypocritical – when bond markets get to thin they scream blue murder because the public “teat” that nourishes them starts to dry up. Think back to 2001-02.
What happened? The Australian government caused the official bond markets to dry up when it used the surpluses it was running to run down outstanding debt. The Sydney Futures Exchange led the charge and demanded that the Government continue issuing debt, which gave the game way – if debt-issuance was to fund net government spending (deficits) then why would they be issuing debt when they were running surpluses?
Answer: it was patently obvious that the outstanding debt was private wealth and its risk-free nature allowed the private investment institutions to price other risky assets and maintain a safe haven when uncertainty rose (by holding bonds).
It was patently obvious that the government, which decided to continue issuing debt was not funding anything.
Please read my blog – Market participants need public debt – for more discussion on this point.
Logic Claim 3. Governments should thus run surpluses to avoid these problems – but make sure they issue debt anyway so the corporate parasites can get their share (as above) and also avoid cutting any spending that … you can fill in the missing line (think vested interests).
The AMP Capital report then tried to sound reasonable:
However, comparing ourselves to a bad bunch is not necessarily wise. First, our level of net public debt (i.e. gross public debt less what the Government is owed) is about where Ireland’s was in 2006 before a severe property crash necessitated the Irish Government to bail out its banks which saw public debt skyrocket. This is unlikely in Australia, but the Irish experience highlights just how quickly good times can turn sour. Second, after the biggest resources boom in our history, public finances should be in far better shape. Norway is a good example in this regard. Realising that its North Sea oil reserves would not last forever, it has been running big budget surpluses (around 10 to 18% of GDP) and putting the money into a sovereign wealth fund for use when their boom is over. As a result, Norway’s net public debt is negative, i.e. it is owed way more than it owes.
1. Comparison with Ireland is irrelevant and dishonest – they use a foreign currency we issue ours.
2. Comparing us with Norway is spurious – they have massive external surpluses that contribute several percentage points to quarterly GDP growth and their private sector hasn’t been forced in to record levels of debt by the surpluses that the government has been able to achieve on the back of the growth. They also have close to full employment. Their surpluses reflect a virtuous cycle.
They have also not savaged their public sector and their services sector has grown within the public sector and provides well paid flexible employment to highly skilled and well-educated citizens. Our public sector has been decimated through privatisation and outsourcing and the service sector is dominated by burger flipping shops which offer poor pay to low-skilled workers.
Further, our surpluses were at the cost of a massive rise in household indebtedness, which will not be repeated and persistently high levels of labour underutilisation. Even at the peak of the last cycle around 10 per cent of available labour resources were idle in Australia. Norway is light years from that situation.
Please read my blog – Norway … colder than us but … – for more discussion on this point.
If Dr Oliver can tell us how we can run have “big budget surpluses”, have private saving high and full employment with our on-going external deficit then I will be interested in his phone call. He won’t ring because it is an impossible combination. Norway and Australia are not comparable therefore in this regard.
The ABC operates under the auspices of the – Australian Broadcasting Corporation Act 1983 – which is the latest version of the Broadcasting and Television Act 1942. The Act outlines the Charter of the ABC, which is so general that almost anything would be possible.
Essentially, the ABC has to provide “innovative and comprehensive” broadcasting services to the nation.
The ABC Board of Directors has a legal duty, among other obligations specified in the Act, to ensure:
… to maintain the independence and integrity of the Corporation
…. to ensure that the gathering and presentation by the Corporation of news and information is accurate and impartial according to the recognized standards of objective journalism
In general, the ABC news and current affairs has become a major perpetrator of the neo-liberal economic myths. Its pretension to balance has disappeared in this regard. I used to write letters to the management pointing out their biases but never received a reply.
Under Section 4 of the ABC’s own – Editorial Policy – which deals with “Impartiality and diversity of perspectives” we read:
The ABC has a statutory duty to ensure that the gathering and presentation of news and information is impartial according to the recognised standards of objective journalism.
They recognise that what constitutes impartiality will “vary among individuals according to their personal and subjective view of any given matter of contention”. I agree.
They say though that they are “guided by these hallmarks of impartiality”:
- a balance that follows the weight of evidence;
- fair treatment;
- open-mindedness; and
- opportunities over time for principal relevant perspectives on matters of contention to be expressed.
They have developed standards which include:
4.2 Present a diversity of perspectives so that, over time, no significant strand of thought or belief within the community is knowingly excluded or disproportionately represented …
4.5 Do not unduly favour one perspective over another.
Now there is clear evidence that they have breached those standards by presenting a right-wing bias.
The right-wing think tanks, politicians, industry groups etc are always claiming the ABC has a left-wing bias. They intone that the Government should discipline the Board, sack staff, cut its budget and privatise it – usually in the same quick news grab.
For example, late last year, the Opposition Leader (soon to be the new Prime Minister) told the Australian Financial Review that “there is still this left-of-centre ethos in the ABC” (Source).
But the evidence is clear. A 2012 academic research article published in the Economic Record – How Partisan is the Press? Multiple Measures of Media Slant – revealed
In a press report when the working paper came out (September 3, 2009) – Study finds ABC bias leans towards Coalition – the conclusion drawn from the paper was that:
The ABC television news was significantly slanted towards the Coalition.
The Coalition are the conservative neo-liberals in Australia although it is hard to tell the difference between them and the so-called progressive Labor party, which holds government at present.
Anyone who watches the news and then the 730 current affairs program on the national broadcaster will not be surprised about the ABC’s pro neo-liberal bias when it comes to economics reporting.
This May 20, 2013 news item – Graphic denial: no plan to dump Kohler – confirmed the worst:
A report in the Australian Financial Review on May 10 claiming ABC management was considering dumping Alan Kohler’s graph-friendly finance segment from the 7pm news is “completely without foundation”, an ABC spokesperson says. “Alan Kohler’s nightly contribution … is highly valued by ABC News, which has no plans whatsoever to discontinue it.”
If they value his propaganda what does it say about them?
Conclusion
I love public broadcasting. But sadly, the national broadcaster in Australia has become part of the problem when it comes to economic news and analysis.
That is enough for today!
(c) Copyright 2013 Bill Mitchell. All Rights Reserved.The Australian Bureau of Statistics released the Consumer Price Index, Australia – data for the September-quarter 2015 yesterday. The September-quarter inflation rate was 0.5 per cent which translated into an annual inflation rate of 1.5 per cent well below the Reserve Bank of Australia’s lower target bound. The inflation rate seems to have stablised for a time at this low rate. The Reserve Bank of Australia’s preferred core inflation measures – the Weighted Median and Trimmed Mean – are now at the bottom end of their inflation targetting range (2 to 3 per cent) and are trending down. Various measures of inflationary expectations are also flat or falling, including the longer-term, market-based forecasts. And this is at at time when the exchange rate has depreciated from 81.2 US cents per AUD in early January to 71.1 cents yesterday, around a 12 per cent depreciation. That depreciation is showing up in the price rises in the September-quarter (international travel costs are up) but the impact on the overall price inflation is minimal.
The summary Consumer Price Index results for the September-quarter 2015 are as follows:
- The All Groups CPI rose by 0.5 per cent compared with a rise of 0.7 per cent in the June-quarter 2015.
- The All Groups CPI rose by 1.5 per cent over the 12 months to the September-quarter 2015, compared to the annualised rise of 1.5 per cent over the 12 months to June-quarter 2015.
- The Trimmed mean series rose by 0.3 per cent in the September-quarter 2015 (down from 0.6 per cent in the June-quarter) and by 2.1 per cent over the previous year (down from 2.2 per cent for the 12 months to June-quarter 2015).
- The Weighted median series rose by 0.6 per cent in the September-quarter 2015 (down from 0.5 per cent in the June-quarter 2015) and by 2.2 per cent over the previous year (down from 2.4 per cent for the 12 months to the June-quarter 2015).
- The significant price rises this quarter were for international holiday travel and accommodation (+4.6 per cent), fruit (+8.2 per cent), and property rates and charges (+4.6 per cent).
- The most significant offsetting price falls this quarter were for vegetables (-5.9 per cent), telecommunication equipment and services (-2.0 per cent) and automotive fuel (-1.7 per cent).
The data comes out at a time when some commentators are challenging the notion that the central bank actually sets the interest rate.
I reported last week in this blog – Friday lay day – banksters misbehaving again but Portugal offers hope – that the big four major banks in Australia were pushing up their mortgage rates, allegedly to cover the cost of implementing the Basel III capital requirements, even though those extra costs would have only justified increases of less than 50 per cent of those actually implemented.
The reality is that the four major banks enjoy well above market returns on equity and consumers pay for it. They can only get away with the price gouging because consumers are inert and do not take advantage of better deals offered by credit unions and building societies.
There is a cultural constraint on competition in the Australian banking sector driven by depositors reluctance to move their business. I don’t understand why people do not abandon the big four banks given their capricious disregard for the consumers that drive their massive profits.
The mortgage rate hikes come at a time when the Australian economy is slowing and their is pressure on the Reserve Bank to drop interest rates anyway, given that the Federal government is intent on pursuing a contractionary stance.
The question has then been raised – will the central bank be forced to lower rates as a result of the big four banks driving mortgage rates up? If the answer to that is yes, then the conclusion to be drawn is that the ‘market’ drives the central bank not the other way around.
Today’s inflation figures might be the catalyst for the central bank cutting interest rates further given that even their preferred measures are heading below the lower bound of their targetting range.
But the central bank won’t drop the rates to compensate for the big four banks’ rate hikes. The reality is that these rate hiikes, while nasty for those who hold mortgages with them do not constitute a contractionary force that has enough scope to undermine economic growth.
For a start only about a third of Australians have mortgages and the evidence seems to support the view that when rates change many people do not adjust their monthly repayment schedules. So this current hike is unlikely to eat into household spending plans in any significant way.
The RBA might drop rates though if interprets yesterday’s inflation data to be a further sign that the economy is in trouble.
But then the RBA has little scope to influence total spending anyway. I dealt with that issue in this blog – Monetary policy is largely ineffective – which detailed why fiscal policy is a superior set of spending and taxation tools through which a national government can influence variations in activity in the real economy.
What is apparent from yesterday’s inflation figures and the most recent labour market data (see blog – Australian labour market – in retreat on the back of poor macro policy settings – is that there is plenty of room for further fiscal stimulus.
Trends in inflation
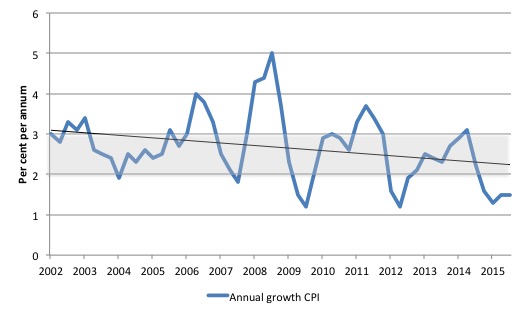
The headline inflation rate increased by 0.5 per cent in the September-quarter 2015 translating into an annualised increase of 1.5 per cent, which is the same result as recorded for the June-quarter 2014.
The following graph shows the annual headline inflation rate since the first-quarter 2002. The black line is a simple regression trend line depicting the general tendency. The shaded area is the RBA’s so-called targetting range (but read below for an interpretation).
The trend inflation rate is downwards.
Implications for monetary policy
What does it mean for monetary policy? The RBA will well understand that the fuel price declines are outliers in the overall trend which is for a moderation of inflation.
The Consumer Price Index (CPI) is designed to reflect a broad basket of goods and services (the ‘regimen’) which are representative of the cost of living. You can learn more about the CPI regimen HERE.
Please read my blog – Australian inflation trending down – lower oil prices and subdued economy – for a detailed discussion about the use of the headline rate of inflation and other analytical inflation measures.
Is a headline rate of CPI increase of 0.5 per cent for the September-quarter 2015 significant for monetary policy decisions? To examine its lasting significance we have to dig deeper and sort out underlying structural inflation pressures and ephemeral price factors.
The RBA’s formal inflation targeting rule aims to keep annual inflation rate (measured by the consumer price index) between 2 and 3 per cent over the medium term. Their so-called ‘forward-looking’ agenda is not clear – what time period etc – so it is difficult to be precise in relating the ABS data to the RBA thinking.
What we do know is that they do not rely on the ‘headline’ inflation rate. Instead, they use two measures of underlying inflation which attempt to net out the most volatile price movements. How much of today’s estimates are driven by volatility?
To understand the difference between the headline rate and other non-volatile measures of inflation, you might like to read the March 2010 RBA Bulletin which contains an interesting article – Measures of Underlying Inflation. That article explains the different inflation measures the RBA considers and the logic behind them.
The concept of underlying inflation is an attempt to separate the trend (“the persistent component of inflation) from the short-term fluctuations in prices. The main source of short-term ‘noise’ comes from “fluctuations in commodity markets and agricultural conditions, policy changes, or seasonal or infrequent price resetting”.
The RBA uses several different measures of underlying inflation which are generally categorised as ‘exclusion-based measures’ and ‘trimmed-mean measures’.
So, you can exclude “a particular set of volatile items – namely fruit, vegetables and automotive fuel” to get a better picture of the “persistent inflation pressures in the economy”. The main weaknesses with this method is that there can be “large temporary movements in components of the CPI that are not excluded” and volatile components can still be trending up (as in energy prices) or down.
The alternative trimmed-mean measures are popular among central bankers.
The authors say:
The trimmed-mean rate of inflation is defined as the average rate of inflation after “trimming” away a certain percentage of the distribution of price changes at both ends of that distribution. These measures are calculated by ordering the seasonally adjusted price changes for all CPI components in any period from lowest to highest, trimming away those that lie at the two outer edges of the distribution of price changes for that period, and then calculating an average inflation rate from the remaining set of price changes.
So you get some measure of central tendency not by exclusion but by giving lower weighting to volatile elements. Two trimmed measures are used by the RBA: (a) “the 15 per cent trimmed mean (which trims away the 15 per cent of items with both the smallest and largest price changes)”; and (b) “the weighted median (which is the price change at the 50th percentile by weight of the distribution of price changes)”.
Please read my blog – Australian inflation trending down – lower oil prices and subdued economy – for a more detailed discussion.
So what has been happening with these different measures?
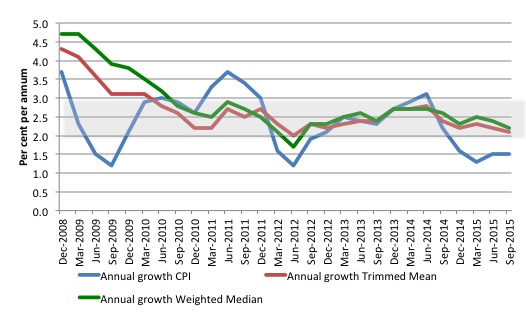
The following graph shows the three main inflation series published by the ABS over the last 24 quarters – the annual percentage change in the all items CPI (blue line); the annual changes in the weighted median (green line) and the trimmed mean (red line). The RBAs inflation targetting band is 2 to 3 per cent (shaded area).
The data is seasonally-adjusted.
The CPI measure of inflation (steady at 1.5 per cent down from the June-quarter 2014) is now well below the target band, while the RBAs preferred measures – the Trimmed Mean (2.1 per cent down from 2.2 per cent) and the Weighted Median (2.2 per cent down from 2.4 per cent) – are now approaching the lower bound of the RBAs targetting range of 2 to 3 per cent.
How to we assess these results?
First, there is clearly a downward trend in all of the measures. The “core” measures used by the RBA have been benign for many quarters even with a relatively large fiscal deficit and record low interest rates. They are now trending down.
Second, it is clear that the RBA-preferred measures are now at the bottom of the inflation-targeting band.
The RBA will also be mindful that real GDP growth is well below trend and faltering and the labour market is weak and getting weaker.
In terms of their legislative obligations to maintain full employment and price stability, one would think the RBA would have to cut interest rates in the coming month given the failing economy and the benign inflation environment.
But the sectoral property market imbalances are suggesting that the RBA doesn’t want rates to be the cause of even more credit-driven property speculation.
Conclusion: Monetary policy is the wrong tool to be relying on.
What is driving inflation in Australia?
The following bar chart compares the contributions to the quarterly change in the CPI for the September-quarter 2015 (blue bars) compared to the June-quarter 2014 (red bars).
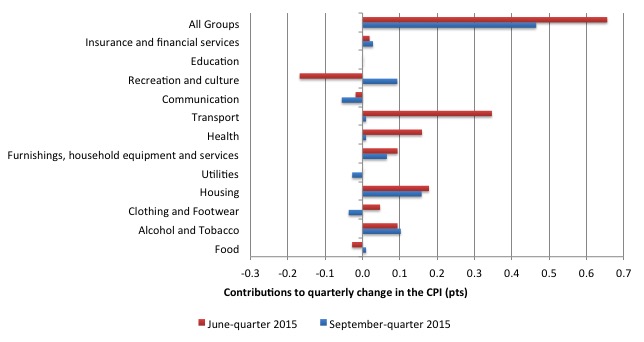
The ABS say that:
The most significant price rises this quarter are international holiday travel and accommodation (+4.6%), fruit (+8.2%) and property rates and charges (+4.6%).
The most significant offsetting price falls this quarter are vegetables (-5.9%), telecommunication equipment and services (-2.0%) and automotive fuel (-1.7%).
The next bar chart provides shows the contributions in points to the annual inflation rate by the various components.
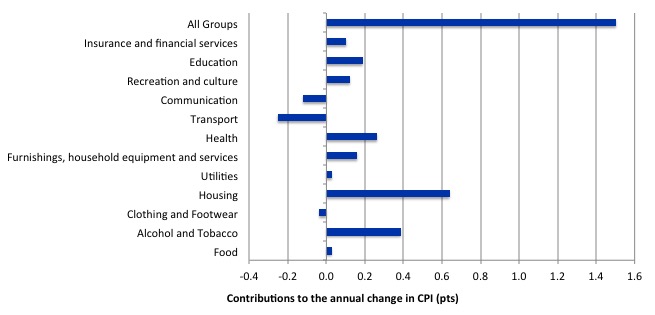
In the twelve months to March 2015, the major drivers of inflation were Education, Health, Housing, and Alcohol and Tobacco prices. The tobacco and health price rises largely reflect government policy changes.
Inflation and Expected Inflation
The fear of inflation, in part, drives this misplaced faith in monetary policy over fiscal policy.
If we went back to 2009 and examined all of the commentary from the so-called experts we would find an overwhelming emphasis on the so-called inflation risk arising from the fiscal stimulus. The predictions of rising inflation and interest rates dominated the policy discussions.
The fact is that there was no basis for those predictions in 2009 and five years later inflation is benign or falling and movements appear to be predominantly driven by cartel activity in energy markets anyway.
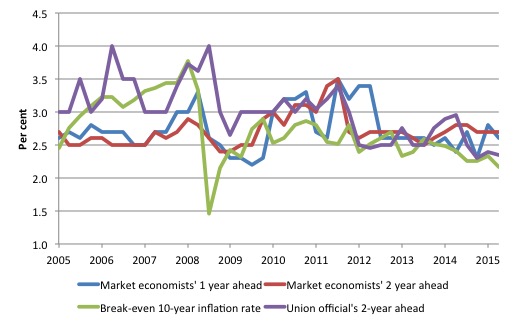
The following graph shows four measures of expected inflation expectations produced by the RBA – Inflation Expectations – G3 – from the June-quarter 2005 to the September-quarter 2015.
The four measures are:
1. Market economists’ inflation expectations – 1-year ahead.
2. Market economists’ inflation expectations – 2-year ahead – so what they think inflation will be in 2 years time.
3. Break-even 10-year inflation rate – The average annual inflation rate implied by the difference between 10-year nominal bond yield and 10-year inflation indexed bond yield. This is a measure of the market sentiment to inflation risk.
4. Union officials’ inflation expectations – 2-year ahead.
Notwithstanding the systematic errors in the forecasts, the price expectations (as measured by these series) are trending down in Australia, which will influence a host of other nominal aggregates such as wage demands and price margins.
The market economists’ two-year ahead is well above the Break-even 10-year inflation rate while the Union officials seem to have a more realistic outlook.
The most reliable measure – the Break-even 10-year inflation rate – is now approaching the lower bound of the RBA targetting range.
The expectations are still lagging behind the actual inflation rate, which means that forecasters progressively catch up to their previous forecast errors rather than instantaneously adjust, which is what a rational expectations theory would suggest. Another blow to the mainstream economics conception of human behaviour!
Conclusion
Just before the GFC hit all the macroeconomic policy talk in Australia was about getting deficits down and into surplus to ensure that inflation didn’t accelerate.
It was nonsensical talk even then when growth was stronger and unemployment lower.
The doomsayers were completely wrong when they predicted the fiscal stimulus in 2008-09 would generate dangerous inflation impulses.
The trend has been down for some years now and some nations are fighting deflation rather than inflation.
The tide is turning in the policy debate – there is now increased commentary that talks up the need for larger deficits and claiming we should not be worried about debt ratios and all the rest of the irrelevant financial ratios that blight the political capacity of governments to maintain high levels of employment and growth.
I will write about that turning in due course. It is not before time.
Yesterday’s inflation data from Australia and the National Accounts data from the UK is more evidence to help speed up the turning tide.
That is enough for today!
(c) Copyright 2015 William Mitchell. All Rights Reserved.
Inflation is down because people cannot afford production.
Which makes the very act of production absurd.
Gold is owned by the banks and is not the source of liberty but the banks might decide to inflate a useless asset (rather then useful stuff) so that people can afford production again or they may wish to see a larger physical system collapse.
Who knows, they own and control all life anyhow.
Its the price you pay for bringing in state sponsored usury.
Inflation is the only option for a debt money system in the long run.
Current deflation practises just a outcome of wholesale theft.
It’s a classic symptom of a lack of flow within physical systems
MMTs concentration on the value of money tokens rather then its utility is quite telling.
“The tide is turning in the policy debate”
Tides are mainly influenced by the lunar cycles. So,reputedly,are lunatics. There is no shortage of the latter in the ranks of the Idiots In Charge.
There may be some improvement in the general run of economic thinking,but I will believe it when I see it.
We would all do well to remember that economics is only a part of the all round clusterfuck which our so called “civilization” has inflicted on itself.
as an aside; today’s Guardian has a video clip by David Graeber on the sectoral balances.
This should stir the pot just a little!;
http://www.theguardian.com/commentisfree/video/2015/oct/28/david-graeber-what-government-doesnt-want-you-to-know-about-debt-video?CMP=ema_632
‘The tide is turning in the policy debate’ –
and after reading this I go to theguardian website where David Graeber has indeed written a piece about household vs govt debt and the symmetry between them. theres already 2000+ comments so not much point in any of us joining in further but its nice to see!
Graeber’s amusing video isn’t quite right and may be confusing in parts. But he is right to focus on the sectoral balances. However, he fails to mention the role of taxation, even though it serves a pivotal role in his video.
Graeber’s article is better than the video, but he isn’t entirely clear here either.. He is misleading when he says that the sectoral balances are not a theory, that they are just maths. This is both right and wrong. It isn’t economic theory. However, it is a part of accounting theory about how to count sectoral balances. And the fact that the math comes out the way the accounting theory says it must come out if things are done the way the theory says they should be done is a test of the theory.
When macroeconomics incorporates this set of theoretical principles as an accounting identity and applies it to the macroeconomy, this constitutes an application of accounting principles in the context of macroeconomic theory. It also serves as a test of these principles. Macroeconomic theoreticians can simply incorporate accounting principles qua sectoral balance algebra as algebraic identities. There is nothing wrong with doing this. This only means that the theoretical justification of such principles lies with accounting. Macroeconomists can simply assume that they are right and incorporate then into their analyses. Doing so, as I mentioned, serves as a test of these principles.
These principles are so fundamental, I can’t see them failing. It would be like denying that 2+2=4, which Descartes almost did. But this identity is part of an arithmetic theory known as Peano arithmetic. And it itself is incorporated into a more inclusive theory. Were macroeconomic theory qua MMT finitely axiomatized, which I do not recommend, these accounting identities would form part of its fundamental assumptions.
This is not the only problem we have with Graeber. Graeber fails to get across the conundrum of what he calls the Peter Paul principle. The Peter Paul situation where whatever Peter gets Paul loses, and vice versa, is essentially a zero-sum game. Which is what Graeber describes. Firms and households are involved in many zero-sum games. And hence, so are the various sectors (where George Stigler would have liked to have married the micro and macro fields of the discipline but failed to do so, as has everyone after him). However, unlike households and firms, the government is not a zero-sum player. Bill has explained many times why this is the case. A way of putting it is to say that the macroeconomy has a fundamental asymmetry built into its very structure.
A conclusion I draw, though others may disagree, is that, where Graeber hoped to spread enlightenment, he sowed confusion instead.
larry
I think the central point that people need to understand is that the government funds the economy, either directly through spending or indirectly through the central bank. Households and firms aren’t zero sum players in any real sense but due to legal constraints imposed by government. Government enforces legal constraints using its monopoly of legitimate violence. When the government does not fulfil it’s duty to fund the economy then state violence is the real constraint on the economy that prevents households and firms from achieving their potential.
I think there is still a widespread belief that the government is funded by the private sector. This then leads to the view that government spending takes money out of the private sector (either by taxation or borrowing). I think when people understand that it’s the opposite then their main objections to government spending disappear.
In New Zealand, the four Australian owned banks that operate here are constantly trying to out-compete each other with lower mortgage rates. Could have something to do with NZ Post’s ”Kiwi Bank” usually having slightly lower rates.
Australian owned BNZ have just posted a increased profit of one billion, so more Kiwi dollars coming your way.
Note: quite a lot of resentment here about Australians profiting from our banking.
Hackey, thanks for your comment. I wonder how people can believe both that the government is the monopoly issuer of the currency and that it is funded by the private sector. Also, where do they think the money for their loans originates? In the bank that gave them the loan? If they believe that, then to be consistent they would have to believe that the bank is loaning them other peoples’ money, money that has been deposited prior to their application for a loan. Ignoring here the fact that people are often inconsistent, even Osborne doesn’t appear to believe this. I am uncertain yet what McDonnell believes, though he has indicated very recently that he believes that taxation is involved in government spending in some way. since taxes come from the private sector, this supports your point regarding what people believe to be the source of money.
I was recently told by an arrogant Labour supporter that it doesn’t matter what the (ontological) truth is, all that matters is what people believe to be the truth (their epistemological position). So, it seems to follow from this that reality doesn’t matter, only that what people believe to be real matters. This is an absurd position to take. And renders it impossible to test policy. The entire process becomes circular.
Larry, if policy makers believe state is fiscally constrained, then they will behave as if it was.
larry
I also liked your bit about maths theory. Unfortunately most people think maths is real, even a lot of mathematicians.