The Reserve Bank of Australia (RBA) increased the policy rate by 0.25 points on Tuesday…
Australia’s inflation rate falling on back of weak spending
The Australian Bureau of Statistics released the Consumer Price Index, Australia data for the September-quarter 2014 today. The quarterly inflation rate was 0.5 per cent (down from 0.6 per cent last quarter) and this translated into an annual rate of 2.3 per cent, down on the 3.0 per cent in the June-quarter 2014. The Reserve Bank of Australia’s preferred core inflation measures – the Weighted Median and Trimmed Mean – are still well within the inflation targetting range and are not trending up. Various measures of inflationary expectations are also flat, including the longer-term, market-based forecasts. This suggests that the RBA may consider that the major problem in the economy is declining growth and rising unemployment, especially in the context of China’s surprise slowdown announced yesterday, and may even cut rates before the year’s end. The evidence is suggesting that the economy is still very sluggish. The benign inflation outlook provides plenty of room for further fiscal stimulus.
The summary results for the September-quarter 2014 are as follows:
- The All Groups CPI rose by 0.5 per cent compared with a rise of 0.6 per cent in the June-quarter 2014.
- The All Groups CPI rose by 2.3 per cent over the 12 months to the June 2014, compared to the annualised rise of 3.0 per cent over the 12 months to June-quarter 2014.
- The Trimmed mean series rose by 0.4 per cent in the September-quarter 2014 (down from 0.8 per cent) and by 2.5 pe rcent (down from 2.9 per cent) for the 12 months to June 2014.
- The Weighted median series rose by 0.6 per cent in the September-quarter 2014 (unchanged) and by 2.6 per cent for the 12 months to June 2014 (slightly down).
- The significant price rises this quarter were for fruit (+14.7 per cent), new dwelling purchase by owner-occupiers (+1.1 per cent), property rates and charges (+6.3 per cent) and other services in respect of motor vehicles (+5.8 per cent).
- The most significant offsetting price falls this quarter were for for electricity (-5.1 per cent) and automotive fuel (-2.5 per cent).
The ABS commented that the “fall in electricity (-5.1%), which fell mainly due to the removal of the carbon price from 1 July 2014.” The Government members will be claiming credit for this decline today but they should be hanging their heads in shame given that the abandonment of the carbon price signalled a major retreat on any policy to deal with climate change. But then the current conservative government are climate change deniers so the policy change was true to form.
Trends in inflation
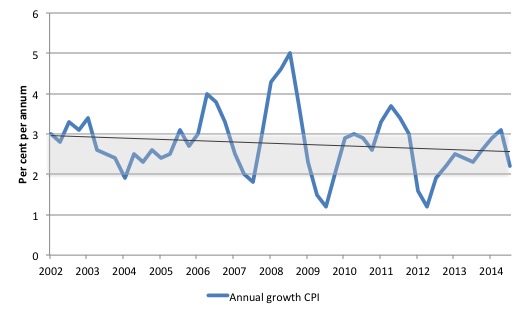
The headline inflation rate increased by 0.5 per cent in the September-quarter 2014 translating into an annualised increase of 2.3 per cent for the year to June 2014 which a significant reduction on the June-quarter 2014 result of 3.0 per cent.
The following graph shows the annual headline inflation rate since the first-quarter 2002. The black line is a simple regression trend line depicting the general tendency. The shaded area is the RBA’s so-called targetting range (but read below for an interpretation).
As noted above, the September-quarter decline in inflation is partly related to the decline in electricity prices. But it also reflects an overall moderation in economic activity.
As the ABC News Report today – Carbon tax repeal eases consumer price rises – indicated today:
… the main declines in the quarter were for electricity (-5.1 per cent) and automotive fuel (-2.5 per cent).
Fuel price falls were mainly a factor of global oil prices and exchange rates, but the electricity price fall was a direct result of the carbon tax being removed from July 1.
It is the first quarter since 1999 that electricity prices have fallen in the ABS index.
However, the 5.1 per cent fall in energy prices did not match the 15.3 per cent increase between the June and September quarters in 2012 when the carbon pricing scheme was first introduced, with non-tax factors at play in both price shifts.
The major negative contributors to this quarter’s CPI figure (as we will see) were Clothing and Footwear and Communication. But there was also weakness in other consumer durable areas, which taken together reflect the weak state of consumer spending and increased willingness of firms to offload unsold inventory via price cuts.
The ABC Report quoted an observer as saying:
Not so much the removal of the carbon tax, but the underlying soft consumer discretionary demand is perhaps the one [thing] that’s putting downward pressure on prices.
That’s the truth no matter what the lying politicians might tell us on the news tonight.
Implications for monetary policy
What does it mean for monetary policy? It will probably mean the RBA will sit tight for a while.
The Consumer Price Index (CPI) is designed to reflect a broad basket of goods and services (the ‘regimen’) which are representative of the cost of living. You can learn more about the CPI regimen HERE.
The ABS say that:
The CPI is a temporal price index for consumption goods and services acquired by Australian resident households. It is an important economic indicator, providing a general measure of price change … The principal purpose of the Australian CPI is to measure inflation faced by consumers to support macroeconomic policy decision making. This is achieved by providing a measure of household consumer inflation by the acquisitions approach.
There are various ways of assessing the general movement in prices depending on the purpose that the measure is being used for.
The document I linked to above details some of the approaches. One of these approaches – the “acquisitions approach” – attempts to measure “household consumer inflation” and defines the basket of goods and services as “consisting of all consumer goods and services actually acquired by households during the base period.”
The ABS use “market prices for goods and services” (including taxes etc) and make no imputations for “non-monetary transactions” (such as imputed rents). They also exclude “interest rate payments”.
So is a headline rate of CPI increase of 0.5 per cent for the September-quarter significant? To examine its lasting significance we have to dig deeper and sort out underlying structural inflation pressures and ephemeral price factors.
The RBA’s formal inflation targeting rule aims to keep annual inflation rate (measured by the consumer price index) between 2 and 3 per cent over the medium term. Their so-called ‘forward-looking’ agenda is not clear – what time period etc – so it is difficult to be precise in relating the ABS data to the RBA thinking.
What we do know is that they do not rely on the ‘headline’ inflation rate. Instead, they use two measures of underlying inflation which attempt to net out the most volatile price movements. How much of today’s estimates are driven by volatility?
To understand the difference between the headline rate and other non-volatile measures of inflation, you might like to read the March 2010 RBA Bulletin which contains an interesting article – Measures of Underlying Inflation. That article explains the different inflation measures the RBA considers and the logic behind them.
The concept of underlying inflation is an attempt to separate the trend (“the persistent component of inflation) from the short-term fluctuations in prices. The main source of short-term ‘noise’ comes from “fluctuations in commodity markets and agricultural conditions, policy changes, or seasonal or infrequent price resetting”.
The RBA uses several different measures of underlying inflation which are generally categorised as ‘exclusion-based measures’ and ‘trimmed-mean measures’.
So, you can exclude “a particular set of volatile items – namely fruit, vegetables and automotive fuel” to get a better picture of the “persistent inflation pressures in the economy”. The main weaknesses with this method is that there can be “large temporary movements in components of the CPI that are not excluded” and volatile components can still be trending up (as in energy prices) or down.
The alternative trimmed-mean measures are popular among central bankers.
The authors say:
The trimmed-mean rate of inflation is defined as the average rate of inflation after “trimming” away a certain percentage of the distribution of price changes at both ends of that distribution. These measures are calculated by ordering the seasonally adjusted price changes for all CPI components in any period from lowest to highest, trimming away those that lie at the two outer edges of the distribution of price changes for that period, and then calculating an average inflation rate from the remaining set of price changes.
So you get some measure of central tendency not by exclusion but by giving lower weighting to volatile elements. Two trimmed measures are used by the RBA: (a) “the 15 per cent trimmed mean (which trims away the 15 per cent of items with both the smallest and largest price changes)”; and (b) “the weighted median (which is the price change at the 50th percentile by weight of the distribution of price changes)”.
While the literature suggests that trimmed-mean estimates have “a higher signal-to-noise ratio than the CPI or some exclusion-based measures” they also “can be affected by the presence of expenditure items with very large weights in the CPI basket”.
The authors say that in the RBA’s forecasting models used “to explain inflation use some measure of underlying inflation (often 15 per cent trimmed-mean inflation) as the dependent variable”.
The special measures that the RBA uses as part of its deliberations each month about interest rate rises – the trimmed mean and the weighted median – also showed moderating price pressures.
So what has been happening with these different measures?
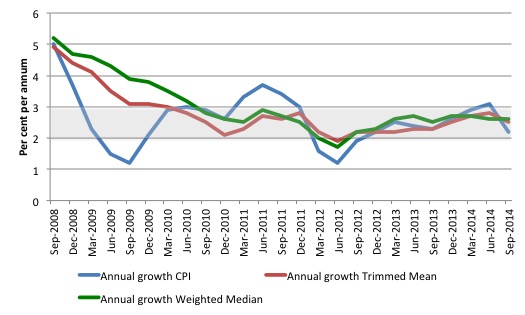
The following graph shows the three main inflation series published by the ABS over the last 24 quarters – the annual percentage change in the all items CPI (blue line); the annual changes in the weighted median (green line) and the trimmed mean (red line). The RBAs inflation targetting band is 2 to 3 per cent (shaded area).
The CPI measure of inflation (at 3 per cent up from 2.9 per cent in the March-quarter 2014) is at the top of the target band, while the RBAs preferred measures – the Trimmed Mean (2.6 per cent and rising from 2.6 per cent) and the Weighted Median (2.7per cent up and stable) – remain within the RBAs band of 2 to 3 per cent.
The data does not indicate an inflation break-out notwithstanding the spike in the September-quarter 2014. See also analysis of contributions below.
But if we dig a little deeper we can understand the current result a bit better.
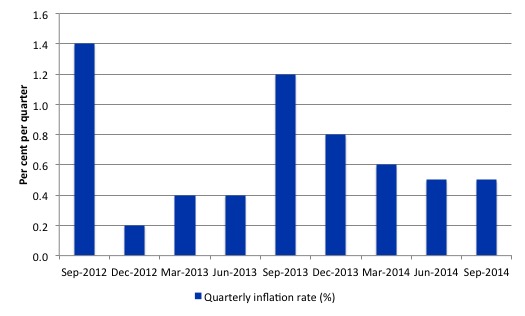
Annualised growth calculations are affected by two things: (a) the current value, and (b) the value four-quarters ago (the base quarter). If there is an unusually low observation in the base quarter then the current annual inflation rate will appear higher than it might otherwise be once we take the influence of the unusually low base quarter.
It turns out that the September-quarter 2013 result (1.2 per cent) was such a quarter (check it in the graph below). This distorts the annualised inflation calculation for the next three quarters. That impact is now out of the annual rates reported in September 2014. The trend in inflation appears to be slightly downward.
The quarterly growth in the headline CPI (the ALL Groups) for the September-quarter 2014 was 0.5 per cent (compared to the trimmed mean and weighted median growth of 0.4 and 0.6 per cent, respectively).
The RBA-preferred measures – trimmed mean and weighted median – are also mostly stable or, in the case of the trimmed mean, falling.
How to we assess these results?
First, there is clearly no upward trend in any of the measures. The “core” measures used by the RBA have been benign for many quarters even with a relatively large fiscal deficit and record low interest rates.
Second, it is clear that the RBA-preferred measures are well within their inflation-targeting band. It is unclear whether what the RBA considers when determining their interest rate decision each month, but given inflation is benign, it may turn its attention to the failing labour market and ease interest rates as a result of that.
Not that the real economy is very sensitive to movements in rates anyway, given that it is hard to discern who wins and who loses from rate changes (the distributional effects across fixed income recipients, creditors and borrowers) and hence it is hard to work out the overall impact on aggregate demand. We know the effect is lagged, uncertain and within normal ranges probably small.
Third, the underlying price pressures (say from wages) are well within the space provided by productivity growth. There is no inflation threat in Australia arising from wages at present given that productivity is rising faster than nominal wages (that is, there have been real wage cuts in recent years).
Fourth, this is all going on as the Australian dollar has been generally falling a period of appreciation which took some pressure to the domestic price level.
What is driving inflation in Australia?
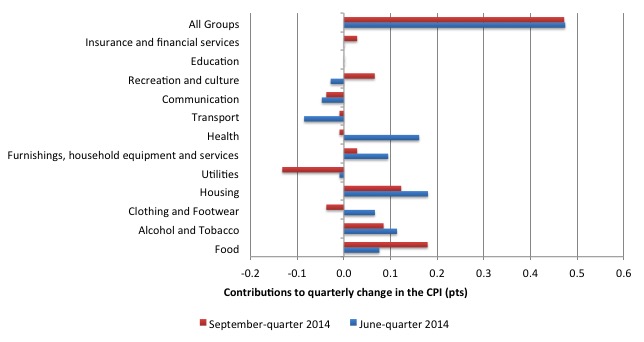
The following bar chart compares the contributions to the quarterly change in the CPI for the September-quarter 2014 (red bars) compared to the June-quarter 2014 (blue bars).
The significant price rises this quarter were for fruit (+14.7 per cent), new dwelling purchase by owner-occupiers (+1.1 per cent), property rates and charges (+6.3 per cent) and other services in respect of motor vehicles (+5.8 per cent).
The most significant offsetting price falls this quarter were for for electricity (-5.1 per cent) and automotive fuel (-2.5 per cent). The negative Utilities contribution is clear.
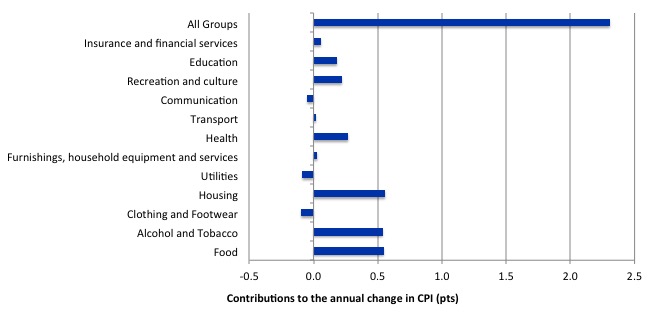
The next bar chart provides shows the contributions in points to the annual inflation rate by the various components.
In the twelve months to June 2014, the major drivers of inflation were food, housing, and alcohol and tobacco prices.
Inflation and Expected Inflation
The fear of inflation, in part, drives this mis-placed faith in monetary policy over fiscal policy.
If we went back to 2009 and examined all of the commentary from the so-called experts we would find an overwhelming emphasis on the so-called inflation risk arising from the fiscal stimulus. The predictions of rising inflation and interest rates dominated the policy discussions.
The fact is that there was no basis for those predictions in 2009 and five years later inflation is benign or falling other than where some cartel controls the supply-price.
Right around the world, these sort of predictions came to nought because they were made by people who didn’t really understand how the macroeconomy works.
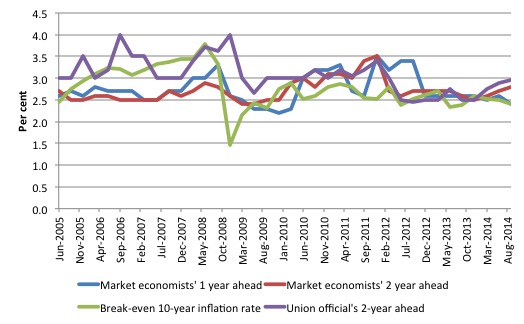
The following graph shows four measures of expected inflation expectations produced by the RBA – Inflation Expectations – G3 – from the June-quarter 2005 to the September-quarter 2014.
The four measures are:
1. Market economists’ inflation expectations – 1-year ahead.
2. Market economists’ inflation expectations – 2-year ahead – so what they think inflation will be in 2 years time.
3. Break-even 10-year inflation rate – The average annual inflation rate implied by the difference between 10-year nominal bond yield and 10-year inflation indexed bond yield. This is a measure of the market sentiment to inflation risk.
4. Union officials’ inflation expectations – 2-year ahead.
Notwithstanding the systematic errors in the forecasts, the price expectations (as measured by these series) are stable in Australia, which will influence a host of other nominal aggregates such as wage demands and price margins.
I suspect the 2-year ahead forecasts reflect what happened in September 2013 (as above) and will dip in the coming quarters. There is no basis to think that inflation will be running at 3 per cent in 2 years time.
How will the RBA respond?
The only direction interest rates are going in Australia after this data release is down. But the RBA may wait another quarter before acting.
It is clear that the economy has slowed and growth is now well below trend growth. The slower growth in China and the excessive supplies of mineral products is depressing both price and volumes at present and that situation is unlikely to change
We are in currently in a situation where the Government is deliberately undermining growth and pushing unemployment up, which is forcing the RBA to use inferior counter-stabilising tools (interest rate management) to stop a recession. The end result is a sluggish economy, rising unemployment and a bias towards pushing up household debt.
The latter point is important. The private domestic sector is presently carrying too much debt and that explains its subdued spending patterns (and the rise in the saving ratio). The Government’s policy is relying on private spending to fill the gap left by the contraction in public spending, given that any expected export revenue growth will be insufficient to drive growth.
The strategy thus relies on the same dynamics that led to the crisis in the first place – too much private debt and inadequately-sized deficits.
Problems with ABS inflation data due to fiscal austerity
Australia also stands apart from other nations by only publishing inflation data every three months. Most advanced nations compile the data every month. The ABS has sought extra funds to allow it to calculate it on a monthly basis, but austerity measures have led to the government refusing to provide such funds.
In addition, the ABS only re-weights the Consumer Price Index (that is, changes the weights of the individual items in the ‘basket’ to reflect changing consumption patterns) every six years now to also economise on its increasingly diminished funding. Previously, it re-weighted every five year. Other nations re-weight more often. Even New Zealand does it every three years.
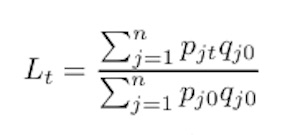
The technical matters can be left aside but the CPI is what statisticians call a Laspeyres Index and the index number is computed according the following formula where j0 refers to the base year value of good j and t refers to the current year.
So the price of the good or service j in period t is written as pjt whereas its price in period 0 (base year) is pj0. The symbol q refers to the quantity consumed and you will note that these are computed as qj0, that is, in the base period.
The Laspeyres Index is thus a ‘fixed weight’ index, which means that the price increases are weighted by the quantities consumed in the base period. All the quantities make up the CPI ‘basket’.
The longer the span between period t and period 0, the more likely it is that the ‘basket’ of goods and services will become increasingly irrelevant as a reflection of current consumption patterns.
As a result, the price index will become a misleading indicator of changes in the cost of living.
To see how it is calculated here is a simple example. Imagine the basket is comprised of only two goods: bread and butter. The price of bread in 2008 was $5 a loaf while butter was $2.50 per kg. By 2014, the price of bread had risen to $5.50 and the price of butter had fallen to $2 per kg.
What is the inflation rate? To calculate a Laspeyres Index we also need to know the quantities consumed in the base year (2008). Say households bought 500 loaves of bread and 100 kg of butter (please don’t work out whether this makes sense or not in terms of proportions of each).
The Index number for 2014 is thus:
L2014 = 100 x (Quantity of bread in 2008 x Price of Bread in 2014) + (Quantity of Butter in 2008 x Price of Butter in 2014)/((Quantity of bread in 2008 x Price of Bread in 2008) + (Quantity of Butter in 2008 x Price of Butter in 2008)
Which if you do the sum would find the result to be 107.3 and if L2008 would be calibrated to equal 100 (obviously). So the inflation rate is (107.3 – 100)/100 = 7.3 per cent.
But if people economised on bread say and by 2014 were consuming on 400 loaves per period then the inflation rate would be lower than 7.3 if that behaviour had have been apparent in the base year.
Fairfax economic writer Peter Martin has a good account of this dilemma in his recent article (October 21, 2014) – Reserve Bank flies blind as numbers don’t add up.
Does it matter?
The Reserve Bank of Australia (RBA) noted in its – Submission to the 16th Series Review of the Consumer Price Index – in March 2010, that:
… a monthly CPI constitutes best practice, and that more frequent data on prices would assist in the assessment of inflation trends in the economy …
More timely data would help provide an earlier indication of the trend in inflation, which is particularly important around turning points. It could also be helpful in distinguishing between signal and noise. In recent years there have been a couple of instances of quarterly readings for inflation that subsequently proved not to be representative of the general trend. The greater frequency of monthly data is likely to allow earlier identification of situations where an observation is unrepresentative.
In that Submission it also recommended “that the expenditure weights in the CPI be updated more frequently than once every six years.”
The RBA concluded that “the use of fixed base weights can result in an upward bias in the measure of price inflation faced by households, as changes in household spending patterns are not captured”.
The last time the ‘basket’ was revised was in 2011 and the next assessment will be made in 2017.
The ABS publish the details of the CPI in the publication – 6461.0 – Consumer Price Index: Concepts, Sources and Methods, 2011.
If you examine the ‘basket’ of goods the ABS currently uses you will undoubtedly find a number of items that are probably now irrelevant due to technological change – for example, photographic film and video tape recorders.
It would be much better if the Government realised the importance of public statistics and funded the ABS appropriately. One only has to compare the quality and coverage of the statistics available from US agencies like the Bureau of Economic Analysis or the Bureau of Labor Statistics to see how poorly served we are in Australia. And the irony of that is that the the US is held out as the exemplar of a free market economy.
Conclusion
Inflation in Australia is now trending downwards despite the occasional spike. On an annualised basis, inflation remains within the lower-bound of the RBA’s inflation targetting range.
The RBA-preferred measures are benign and inflationary expectations are also not presenting any issues.
The data continues to suggest that the national economy is subdued as a result of excessively tight fiscal policy and declining private spending.
That is enough for today!
(c) Copyright 2014 Bill Mitchell. All Rights Reserved.
Green taxes and carbon taxes are dumb.If a government is concerned about carbon emissions it should just invest in R&D for clean technology,and provide cheap loans for clean energy infrastructure projects. Carbon taxes just increase the cost of living for normal people.
The point of the carbon tax was to put a price on carbon per ton so the various carbon offset schemes could get off the ground. Now the bottom has dropped to almost nothing.
Besides, the carbon tax was balanced by other payments (like the schoolkids bonus). The cost of living increase was pure profiteering by the power companies, as demonstrated by the 15% increase but only 5% decrease since the tax was repealed.
I’d like to say that I really don’t understand the reluctance of the Australian government(s) towards having adequate empirical statistical data?
Funding the policy or any policy is never an issue (see bombing ISIS) when the government of the day wants to take action.
Sadly I cannot when rule by mindless ideology seems to be in vogue.
World’s researchers to Canada: Stop censoring science!