I started my undergraduate studies in economics in the late 1970s after starting out as…
Australian industry employment trends and fiscal stimulus
I am continually distracted by the daily entertainment from Europe – who could have written such a script? – bumbling from one disastrous “solution” to another, accusing each other of various sins, trying to rope Britain into their incompetence (although the latter doesn’t need any help in that department) etc. But the comedy ends as soon as the human element is considered. How long the citizens will remain docile is the big question. I had an interesting meeting the other day about a joint research project I am becoming involved in which will encompass that sort of enquiry including what has happened to the “left”. Anyway, today’s blog is a bit more pedestrian. I have been asked a lot recently by journalists and radio interviewers about the flat employment growth in Australia at present in the context of our so-called “once-in-a-hundred-years” mining boom. The mining industry has been so successful at self-promotion that people forget it only accounts for 2.1 per cent of total employment (a minuscule proportion). Anyway, the ABS released the detailed quarterly employment data for November 2011 yesterday which contains industry breakdowns. So I went digging this morning to bring my analysis up to date. Lesson: fiscal stimulus works and the Australia labour market is changing.
To put this analysis in context I would also read my latest analysis of the November Labour Force survey which came out last week. It doesn’t include any industry breakdowns but is nonetheless complementary to this employment-focused study.
The ABS publish detailed industry employment data according to the Australian and New Zealand Standard Industrial Classification (ANZSIC) 2006. It is consistent with the International Standard Industrial Classification of All Economic Activities (ISIC) which is widely used by national statistical agencies.
The classification is periodically updated to reflect changing industry composition etc and the last update to the ANZSIC was in 2006.
The ABS describe the ANZSIC in this way:
The ANZSIC is a hierarchical classification with four levels, namely Divisions (the broadest level), Subdivisions, Groups and Classes (the finest level). At the Divisional level, the main purpose is to provide a limited number of categories which provide a broad overall picture of the economy and are suitable for the publication of summary tables in official statistics. The Subdivision, Group and Class levels provide increasingly detailed dissections of these categories for the compilation of more specific and detailed statistics.
1.22 The hierarchical structure of the ANZSIC is illustrated below.
Level Example
Division C Manufacturing
Subdivision 11 Food Product Manufacturing
Group 111 Meat and Meat Product Manufacturing
Class 1111 Meat Processing
The analysis that follows is at the Division level (which used to be referred to as the 1-Digit level) and “ANZSIC 2006 separately identifies 19 divisions” (or industry sectors). In the following Tables you will see the divisional demarcations.
So a lot of information to present graphically or by way of table.
The following provides some summary information that allows you to see how the Australian labour market (in terms of industry employment has changed over the last few years).
Remember that there has been a major crisis following a strong growth period. The Australian government responded to the crisis early and in December 2008 and February 2009 they implemented very significant fiscal stimulus measures mostly aimed at the construction of public infrastructure. There was a smaller fiscal stimulus introduced in October 2008 but that was dwarfed by their later efforts.
Since the latter part of last year (approximately) the stimulus has been withdrawn (by design) and employment growth has flagged.
The Government withdrew the stimulus because it claimed the primary commodities boom associated with the mining sector would drown the economy with spending and expose us to accelerating inflation. It is true that commodity prices are at record levels (as is our terms of trade) and export volumes have growth strongly (in base metals etc).
But it is also true that overall economy growth is well below trend and unemployment is rising again and inflation is falling. Further, the external sector – notwithstanding the boom is draining growth via the Primary and Secondary income channels in the Current Account balance. The government sector is also draining growth.
So can we see evidence of the positive impacts of the stimulus since the crisis began? What has been happening with respect to the commodities boom?
The low-point unemployment rate from the last growth cycle occurred in February 2008.
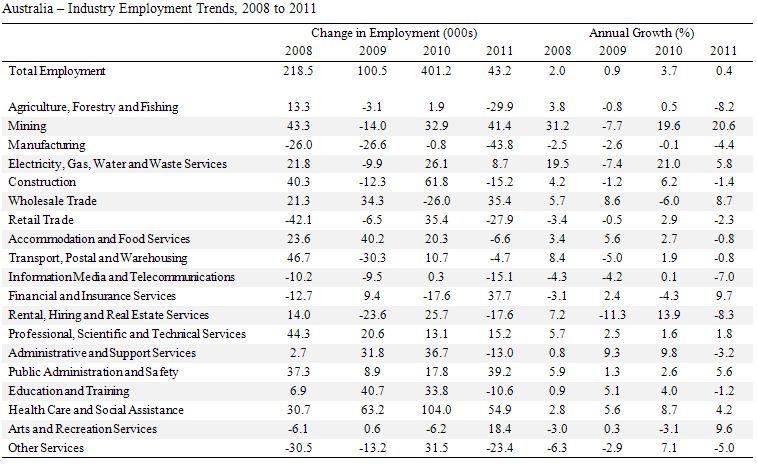
The following table summarises the aggregates based on an annual November to November quarter basis. Columns 2 to 5 show the absolute change in employment for the economy as a whole and the 19 industry divisions.
Columns 6 to 9 express these changes in terms of percentage growth over the same periods.
The results are quite fascinating.
First, the trend in total employment is clear. The downturn took some time to impact but by 2009 employment in Australia was faltering and being supported mainly by the early stages of the fiscal stimulus.
Second, once the fiscal stimulus kicked in (2010) employment growth accelerated sharply with 4 times the net job creation relative to the previous year. You can get a feel for the direct impacts of the fiscal stimulus by examining the construction sector.
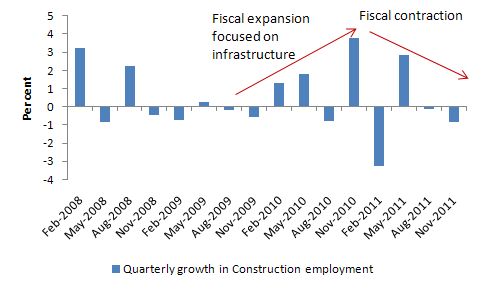
This sector normally is one of the earliest to contract in a recession and in 2009 that is what happened. As the big national public infrastructure projects came into operation, Construction rallied in 2010 as the big public infrastructure projects unfolded (the school building program) but has contracted again as the fiscal stimulus is being withdrawn.
The next graph shows quarterly growth in Construction employment since February 2008 which allows you to see more clearly the quarterly profile of the rise and fall of this sector’s employment.
Third, in terms of structural change, you can see the secordal decline in Manufacturing over this period and that decline has accelerated this year – probably as a consequence of the rising AUD.
Fourth, despite what the mining barons have been trying to tell the Australian population (principally as a ploy to make threats about the proposed imposition of a resources rent tax by the Federal government), the Mining sector did not save the economy from recession. Its total employment contracted sharply in 2009 on the back of declining world demand for our exports.
It was China’s fiscal stimulus that saved its economy from slowing down dramatically and this eventually impacted positively on our export sector. So in a way you could say that fiscal stimulus saved the Mining sector.
But it is also clear how substantial the change in mining employment has been in 2010 and 2011 as the demand for our resources has sky-rocketed. In February 2008 at the peak of the last cycle, mining accounted for 1.3 per cent of total employment. Its share in November 2011 had risen significantly to 2.1 per cent.
The following graph shows the quarterly growth in Construction employment from February 2008 to November 2011. The annotations tell the story.
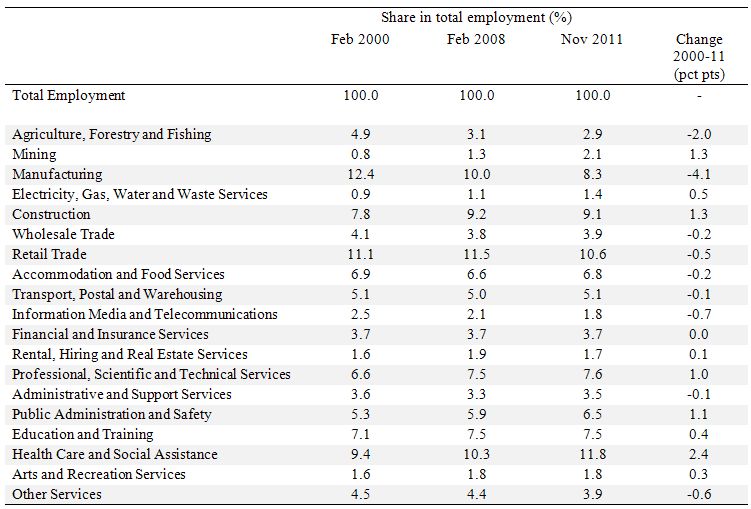
The following table shows the changing industry shares in total employment (winners and losers) as a result of the impacts of the fiscal stimulus and the significant structural change that is emerging. We compare February 2000 with February 2008 (the peak of the last cycle) and November 2011.
The FIRE sector which increased its share in the previous growth boom has declined marginally as a result of the slowdown in real estate speculation.
The public sector (concentrated in Public Administration and Safety, Education and Training, Health Care and Social Assistance and Arts and Recreation Services) has expanded (fiscal stimulus effect) although Education and Training is largely static which shows you the priorities of our governments.
The commodities boom is clear – Mining has increased its share by 1.3 times. While the decline in the share of Agriculture and Manufacturing is sectoral (trend) it is also being exacerbated by the exchange rate effects of the strong terms of trade.
The decline in Retail in recent years is evident and reflects the growth of consumption fuelled by credit in the period leading up to the crisis followed by a much more cautious household sector in the period after the crisis. Households have changed their saving behaviour significantly in the recent years.
Conclusion
The employment data shows a changing Australian economy – at least for the time being. Mining booms are notorious – they crash very badly when the terms of trade cycle ends.
Moreover, the data shows clear evidence of the positive impacts of the introduction of the fiscal stimulus and the negative impacts of its withdrawal.
Fiscal Austerity or Stimulus Panel Discussion – December 8, 2011
This Panel was held on December 8, 2011 as part of the 13th Path to Full Employment Conference/18th National Unemployment Conference which was held between December 7-8, 2011 and hosted by the Centre of Full Employment and Equity at the University of Newcastle (Australia).
The video runs for just over an hour and contains the introductory statements from each panellist and the following Q&A session.
The Panel consisted of:
- Professor William Mitchell (CofFEE, University of Newcastle)
- Professor L. Randall Wray (UMKC-Missouri)
- Professor Joan Muysken (CofFEE-Europe, University of Maastricht)
- Dr Bruce Philp (Nottingham Trent University)
You can also download my slides in PDF.
Noyer calls on S&P to downgrade Britain but receives a lesson in economics from Lagarde
The UK Guardian article (December 15, 2011) – Note to Noyer: don’t suggest other countries should be downgraded – published this photo which showed the IMF boss whispering to the French central bank governor Christian Noyer at a G20 finance summit. The Bank of England governor Mervyn King is to her right.
The Guardian noted that Noyer said in relation to the S&P threats to downgrade French sovereign debt that:
A downgrade does not appear to me to be justified when considering economic fundamentals. Otherwise, they should start by downgrading Britain, which has more deficits, as much debt, more inflation, less growth than us and where credit is slumping.
To which we might have just said – “Loser”. But I needed to know more.
As a curious researcher-type I wondered what the former French finance minister had whispered to Noyer given she clearly did not want King to hear.
After an elaborate and exhaustive process of consultation with my extensive international network I discovered the uncensored photo.
You can view it in all its scandalous detail if you click the photo above. I was told this was censored by the highest authorities in France. They are keen to protect the central bank governor (and the former finance minister) from accusations that they haven’t got a clue (-:
Saturday Quiz
The Saturday Quiz will be back sometime tomorrow – about the same as always!
That is enough for today!


“I had an interesting meeting the other day about a joint research project I am becoming involved in which will encompass that sort of enquiry including what has happened to the ‘left’.”
That’s a very good and interesting question.
There’s no left left… hope you find where’s hiding and tell to us.
@ juanbeard
On hiding hope – ‘ the cage door is open, but who will explain to the little fiat bird she is free’: Heteconomist – Money and Paths to a Post-Capitalist Society