Well my holiday is over. Not that I had one! This morning we submitted the…
Australian government announces a small shift in the fiscal deficit and it was if the sky was falling in
Yesterday (December 19, 2024), the Australian government published their so-called – Mid-Year Economic and Fiscal Outlook 2024-25 (MYEFO) – which basically provides an updated set of projections and statuses of the fiscal position six months after the major fiscal statement was released in May. One would have thought the sky was falling in given the press coverage in the last 24 hours. The standard of media commentary in Australia on fiscal matters is beyond the pail.
The press has gone into overdrive in the last 24 hours:
1. “Chalmers’ legacy a decade of deficits”.
2. “Australia’s budget deficit to balloon by $21.8 billion over next four years”.
3. “Gambling sector stunned by axing of tax breaks”.
4. “Real big spender from the minute he walked into the joint”.
5. “MYEFO to condemn Labor to deficit”.
6. “Treasurer confirms horror economic news”.
7. “Bigger and hidden deficits are the real MYEFO result”.
8. “Soaring MYEFO deficit delivers a wake-up call for Commonwealth Government”.
9. “Budget update reveals deficits $21.8b worse than expected — as it happened”.
10 “‘Not terrific’: MYEFO forecasts budget deficits”.
11. “the longer term story ‘remains quite worrying.'”
12. “the budget blowout”.
And on it went as copy editors competed with each other to cast a shadow of doom over the economic release.
The Treasurer (Chalmers) didn’t help matters claiming that “The difference between breaching that $1 trillion, the couple of years difference there, means an absolute mountain of demand and debt interest avoided in the meantime.”
At the last election, Chalmers became a sort of talking monkey with his constant repetition of the mantra ‘the nation is heaving with a trillion dollars of debt’.
Everywhere he spoke it was the ‘heaving’ line.
Ad nauseum, to say the least.
Now, conveniently, he ignores his own warning.
And, for the record, it was a pathetic warning anyway.
The financial market commentators that the national broadcaster seems to rely on these days for alleged authoritative or expert commentary were full of “spending like a drunken sailor” and an array of other lurid metaphors that have zero meaning in the context of a currency-issuing government.
One character was quoted as saying:
… the sobering reality is that the more the public sector insists on spending, the less private sector spending the RBA is willing to tolerate.
Which sums up how bad the commentary is.
The reasoning is all backwards here.
The fact that the government has been spending more lately is exactly because the private sector is spending less as a result of the RBA’s rogue monetary policy which is unnecessarily pushing the economy towards recession.
If the RBA had not adopted its mindless interest rate hikes we would have observed two things among others.
1. The inflation rate would have fallen anyway, given that the drivers were not related to excessive spending (which might be sensitive in some ranges to interest rate changes).
2. Private sector spending would have been stronger and as a result of the cyclical impacts on the fiscal balance – the fiscal deficit would have been smaller.
For those calling on the government to cut spending they conveniently ignore the fact that the only reason that GDP growth, weak as it is, remains positive, is because of the government spending.
I discussed that issue in this recent blog post – British Labour Government is losing the plot or rather is confirming their stripes (December 12, 2024).
Unsuspected listeners think these characters are ‘experts’ when, in fact, they are just boosters for the profitability of their own institutions.
The data
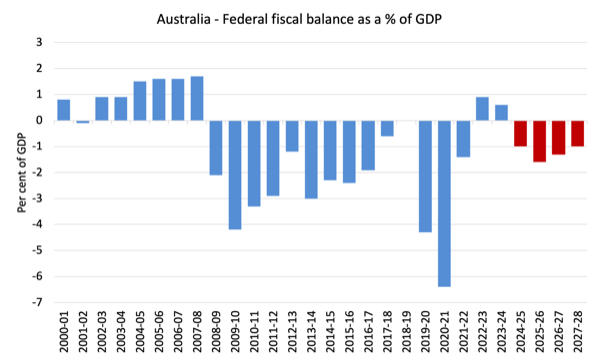
The following graph shows the fiscal balance since the financial year 2000-01 with the last four (red) columns being the so-called forward estimates of the balance.
You have to wonder what all the fuss has been about.
The fiscal deficit is forecast to be 1.0 per cent of GDP in the coming financial year (2024-25) then rise to 1.6 per cent, before dropping to 1.3 per cent and 1 per cent over the remaining two financial years of the forecast period.
Minuscule and certainly not large enough to deal with the challenges that the nation faces with respect to climate response, restoring some housing equity, and boosting the failing education and health sectors.
To meet those challenges, the fiscal balance is going to have to be much larger for a long period – so you can imagine how many heart attacks there are going to be among the media commentators as that reality sets in.
The press are touting the $A26,949 billion fiscal deficit figure because they know that 1 per cent of GDP doesn’t sound scary enough.
If is farcical.
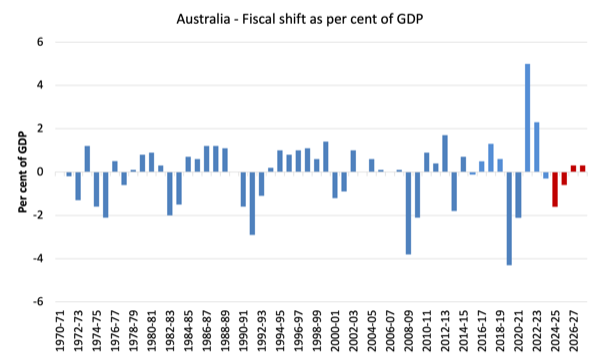
The following graph shows the fiscal shift from year to year in terms of percent of GDP.
So a positive number means the fiscal position is becoming less expansionary (in terms of supporting growth and employment), while a negative number indicates the opposite.
So for all the talk of ‘drunken sailors’, it appears the sailors are acting in a rather sober manner.
For the last three years of the forward estimates the government is planning to adopt a contractionary fiscal stance.
The next graph shows the evolution of federal government spending and revenue receipts from 1970-71 to 2027-28 (with the dotted lines being the forward estimates).
This graph has led to claims that government spending is ‘out of control’ and there is a widening gap between tax revenue and spending.
One commentator disclosed his ignorance when he wrote:
Neither side of Australian politics has been willing to have an ‘adult conversation’ with the Australian people about how all this additional spending should be paid for … the burden is falling disproportionately on younger generations (the same ones who are finding it much harder to become home-owners than their parents or grandparents did).
It is hard to answer that sort of commentary except to say that if we really wanted the younger generations to have better access to housing ownership then we would require larger deficits.
The housing crisis is largely due to the abandonment by governments (federal and state) of their responsibility to supply social housing, which has created a major supply shortage.
That abandonment coincided with the rising fetish for fiscal surpluses and the major cutbacks in government investment in housing infrastructure that followed.
Further, the additional spending (as he terms it) is funded the moment the computer operator in the government presses the spend button and credits appear in the banking system (or cheques are printed and mailed out).
The government can run a deficit forever without any burdens falling on the younger generation.
I also wonder what the reaction would be from these financial market commentator types if the government decided to cut back spending by ending the heavy government subsidies to the elite private schools (which get a disproportionate amount of federal assistance).
Or, in addition, the federal government could always cut back its subsidies to the profit-seeking private health system that serves the elites.
We can guess what the reaction would be.
The only issue I would have with the current revenue mix, is that it is heavily weighted towards income taxes and that means lower-income earners who cannot afford fancy accountants are paying a disproportionate share, while big corporations who get government handouts, are able to manipulate their books to avoid paying any tax in some notable cases.
This comment should not be taken in any context that the tax revenue is funding the government spending.
The point is that the government has to take back some of its spending in the form of taxes to create the ‘fiscal room’ (resource space) in which it can spend without creating inflationary pressures.
Who should bear the burden of that process?
Answer: Certainly not the low-income workers.
The current system is, unfortunately, forcing those workers to bear the burden.
Where is the growth coming from?
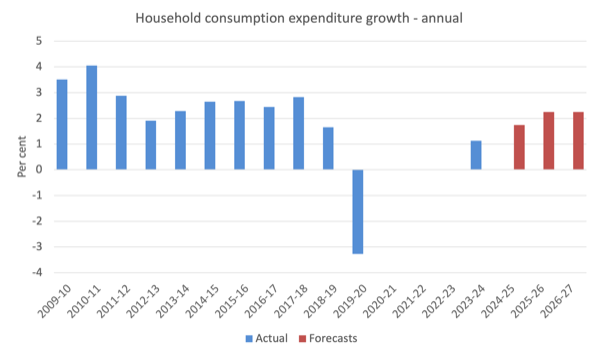
The 2024-25 fiscal statement now forecast that real household consumption expenditure will grow by 1.75 per cent in 2024-25, by 2.25 per cent in 2025-26.
The following graph shows the annual real Household consumption expenditure growth from 2009-10 to 2023-24, with the red bars capturing the Government’s projections.
I took out the two early COVID observations given how extreme they were (in either direction).
In the September-quarter 2024 national accounts data, the annualised growth was 0.4 per cent but the quarterly result was -0.04 per cent.
In other words, the government’s forward estimates are very optimistic based on what is likely to happen in 2024-25.
Normally we would expect household expenditure growth of that magnitude to come from a very strong real wages growth environment.
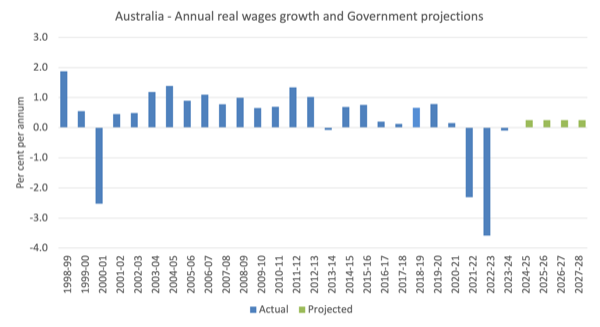
But wages growth has been at record low levels and the updated fiscal statement is projecting very modest the real wages growth indeed on the back of some heroically optimistic nominal wages growth estimates.
The following graph shows real wages growth out to 2027-28.
The underlying forward estimates of nominal wages growth are far too optimistic, which means that it is unlikely that real wages will grow much over the next few years.
Conclusion: The Government is wanting us to return to the unsustainable situation where private debt escalates to maintain household consumption expenditure while wages growth remains subdued.
We know that the financial balance between spending and income for the private domestic sector (S – I) equals the sum of the government financial balance (G – T) plus the current account balance (CAB).
The sectoral balances equation is:
(1) (S – I) = (G – T) + CAB
which is interpreted as meaning that government sector deficits (G – T > 0) and current account surpluses (CAD > 0) generate national income and net financial assets for the private domestic sector to net save overall (S – I > 0).
Conversely, government surpluses (G – T < 0) and current account deficits (CAD < 0) reduce national income and undermine the capacity of the private domestic sector to accumulate financial assets.
Expression (1) can also be written as:
(2) [(S – I) – CAB] = (G – T)
where the term on the left-hand side [(S – I) – CAB] is the non-government sector financial balance and is of equal and opposite sign to the government financial balance.
This is the familiar MMT statement that a government sector deficit (surplus) is equal dollar-for-dollar to the non-government sector surplus (deficit).
The sectoral balances equation says that total private savings (S) minus private investment (I) has to equal the public deficit (spending, G minus taxes, T) plus net exports (exports (X) minus imports (M)) plus net income transfers.
All these relationships (equations) hold as a matter of accounting.
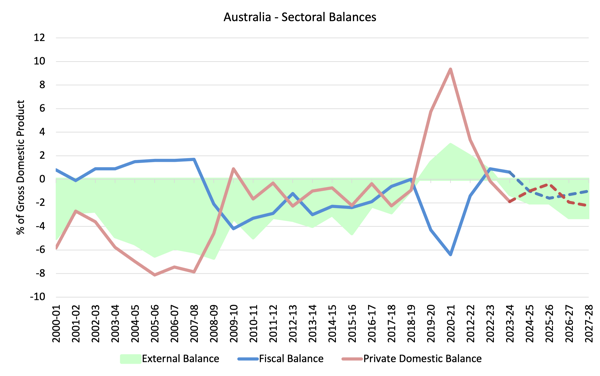
The following graph shows the sectoral balance aggregates in Australia for the fiscal years 2000-01 to 2027-28, with the forward years using the Treasury projections published in the updated MYEFO statement.
The projections begin in 2024-25.
I have assumed that the external position forecast for 2026-27 will persist into the next financial year.
That is not a problematic assumption, given that the 2026-27 estimate is very close to the long run average.
All the aggregates are expressed in terms of the balance as a percent of GDP.
I have modelled the fiscal deficit as a negative number even though it amounts to a positive injection to the economy. You also get to see the mirror image relationship between it and the private balance more clearly this way.
The dotted lines are the projections.
It is obvious that during the early years of the pandemic, the enlarged fiscal deficits allowed the private domestic sector (households and firms) to lift thie saving as a percent of GDP.
With the fiscal tightening that followed, the private domestic sector were forced into deficit overall and that situation persist as the external sector moves back into deficit.
In other words, the fiscal deficit is too small to cover the spending gap caused by the expanding external deficit, which means the private domestic sector is unable to save overall.
In the post 1990s period, the household sector, in particular, accumulated record levels of (unsustainable) debt (that household saving ratio went negative in this period even though historically it has been somewhere between 10 and 15 per cent of disposable income).
The fiscal stimulus in 2008-09 saw the fiscal balance go back to where it should be – in deficit. This not only supported growth but also allowed the private domestic sector to start the process of rebalancing its precarious debt position.
Every time the government’s surplus obsession leads to contractionary policy changes, the private domestic sector moves into deficit.
Overall, the strategy outlined in yesterday’s fiscal statement is once again placing the economy on an unsustainable path relying on household debt accumulation.
And why didn’t the media connect the days
It seems that the media has a short concentration span.
One might forgive the journalists for forgetting what happened last week, but to not connect a major data result yesterday to another today demonstrates how little these commentators know.
Today (December 19, 2024), the Australian Bureau of Statistics released the detailed – Australian National Accounts: Finance and Wealth.
In its press release – Household wealth up 2.4% in September quarter – the ABS said that:
Household wealth rose for the eighth quarter in a row, up 2.4 per cent or $401 billion in the September quarter 2024 … Total household wealth was $16.9 trillion in the September quarter, which was 9.9 per cent ($1.5 trillion) higher than a year ago.
I will have more to say about this data another time.
But after yesterday’s doom projections about the fiscal position, today the media, without notice, shifted to extolling how good it was that private domestic sector wealth had risen so strongly.
Not one commentator I read or heard on the radio linked the two data releases.
It is obvious that if the fiscal deficit was not rising modestly, the private domestic sector’s net financial position would not have improved as it did, given other factors.
I will explain that more carefully in another blog post.
But the fact that no-one picked up the direct causal connection tells us how little these ‘experts’ actually know.
There are also worrying aspects to the wealth data.
The RBA’s ridiculous interest rate hikes have allowed for a massive redistribution of wealth from low-income mortgage holders to high-income holders of financial assets.
That is part of the story too.
Conclusion
The standard of media commentary in Australia on fiscal matters is beyond the pail.
That is enough for today!
(c) Copyright 2024 William Mitchell. All Rights Reserved.
The Guardian journalist Larry Elliott continues propagating his befuddled analyses of the Economy.
Comparing a currency-issuing nation (UK) with those in the EU (Germany and France).
No wonder many think that the federal budget is drafted in the breakfast nook at The Lodge.
Germany and France are in crisis – is the next global financial crash brewing?
https://www.theguardian.com/commentisfree/2024/dec/19/germany-france-crisis-next-global-financial-crash
It feels like everything is regressing again. Back in 2021, everyone was talking about Biden’s spending bills, increased Government spending, atleast in the first world. The actual spending turned out to be fraction of the proposed one.
Now everything is back to early 2010s. All the talk of DOGE (ugh) cutting everything but military and police spending by hundreds of billions of dollars.
Two minor typos: “pail” should be “pale” (a stake or fencepost demarking a border), and CAD should be CAB (CAB appears in two places in the explanation of the sectoral balances equation).
Feel free to delete this post.
After reading this, I stumbled across Headline No. 6:
“Treasurer confirms horror economic news”,
accompanied by a head shot of Jim Chalmers looking like he was announcing that an asteroid was about to hit Canberra.
Of course there was nothing in the accompanying article to justify such hysteria, only mainstream lamentation about the predicted deficits and a predictably ridiculous response from shadow treasurer Angus Taylor.
While I could never condone such mischief, I wish the financial jounalists that produce this rubbish could all open their devices to find their screensavers replaced (permanently if possible) by Bill’s sectoral balances graph, which really says it all.
The statements by the politicians and the comments by the media regarding the budget are comical. Unfortunately, the ramifications are no laughing matter. The silence of the mainstream economics profession, as these statements and comments emerge, is deafening, although that has as much to do with the fact that most of them don’t take any notice of the budget bottom line or the comments because they are too busy writing up the meaningless results of a mathematical game played in economic fairyland that they’ve performed on the back of a serviette in an airport lounge.
We won’t get anywhere until there is a Kuhnian scientific revolution in economics, albeit it is a necessary but insufficient condition for true progress to be made. Some people believe we won’t get anywhere until most of the population understand a bit of MMT. I disagree. There is no more need for the general population to understand MMT than there was a need for the general population to understand a bit of cardiology for my heart arrythmia caused by an inherited heart condition to be medically resolved. It was resolved because cardiologists understand how the human heart works. One cannot say the same for mainstream economists with respect to the economy.
Mind you, a lot of heterodox economists understand aspects of the economy that mainstream economists don’t but are just as (if not more) ignorant of other aspects. Most Ecological Economists don’t understand modern money. Most Post-Keynesian Economists don’t understand the ecological setting of an economic system and the basic physical laws governing production, which isn’t production at all (the first law of thermodynamics stipulates that one cannot create or destroy matter and energy), but the transformation or rearrangement of low-entropy matter and energy (i.e., natural resources that can only be sourced from the ecosphere and which are always absolutely scarce, not rendered artificially scarce – stop confusing artificial scarcity with institutional deprivation!) by human labour and human-made capital, both of which are also products of physical transformation. Plus, they don’t understand that thanks to the second law of thermodynamics – the Entropy Law – energy can only be used once; degraded matter, following its transformation, cannot be 100% reconcentrated; and whatever waste matter is reconcentrated for future transformation requires the use of more energy.
Consumption, on the other hand, involves the disarrangement of matter and energy – the product of rust, rot, and decay. Whereas production is a use value-adding process, consumption is a use value-destroying process. Neither can be avoided. However, the latter can (should) be minimised in order to minimise the need for the former, which would minimise the need to disrupt ecosystem functionings (cost) to extract scarce natural resources in order to maintain stocks of useful human-made stuff (benefit). If we produce high-quality stuff and distribute it equitably, thereby reducing the need to produce lots of stuff, we can obtain lots of benefit for very little cost (maximise net benefits). At present, by confusing means with ends, we are producing a lot of junk (a large portion of a bloated GDP) and distributing it inequitably, thereby obtaining minimal benefit at a very high cost (not maximising net benefits).
Some countries are better than others at coming closer to the latter. They have a higher per capita Genuine Progress Indicator (GPI), which measures the difference between the benefits and costs of economic activity (heaven forbid!), even though some of them have a lower per capita GDP, which measures the volume of economic output.
Getting back to my point. If we have to wait for most people to understand a bit of MMT, we will be waiting forever. I have just finished reading Bill and Warren’s latest co-authored book. I thoroughly enjoyed it, especially the early part of the book outlining the beginning of their MMT journey both individually and together (enthralling), and recommend it to everyone. However, a lot of what is in the book will go straight over most people’s heads. That’s not Bill and Warren’s fault. I don’t think it’s possible to explain some of the MMT stuff any simpler and clearer than they do. But we live in a complex world. The economy is a complex part of that world. We can’t expect the general population to understand every aspect of this complex world, and they won’t. No-one will. But we should expect the economics profession to understand the economy and its place in the wider world so that policy-makers can make informed decisions and not make comical statements, just as I expected my cardiologist to understand why I had a heart arrythmia. And it doesn’t. And they don’t. Nowhere near it. And I have no idea what will trigger the desperately needed Kuhnian scientific revolution in economics. But it needs to happen very soon. The situation is not helped by a flawed academic reviewing process. Every social sciences article submitted to an academic journal should be reviewed by at least one person in a different field of social sciences and at least one person in the physical sciences. And vice versa. All academic journals should be required to reveal the academic field of the reviewers of a particular article. Not many mainstream economics papers would survive the process.
Neo-liberali$m mixed with the Dunning-Kruger effect appears to be the beverage of choice for political commentators these days.
Politicians crying woe is me, there are no cookies in the cookie jar.
Taxpayers then be like, woe is me, too much waste of my taxes on bla bla…
Wash rinse repeat, the myths remain and the paradigm of austerity rises again.
Smh…
“… the sobering reality is that the more the public sector insists on spending, the less private sector spending the RBA is willing to tolerate. ”
I suspect you are seeing comments like the above because the RBA governor and other senior officials have commented that public sector and non market sector spending has been stronger than they’d been anticipating. In the RBA’s view this was leading to “excess demand” and muting the downward trajectory of inflation.
The journos interpret this as crowding out and then go to town.
RBA should not have cut rates to zero (0.10%) any more than taking rates up to 4.35%. Frydenberg’s Jobkeeper program was poorly targeted and failed to have a formal clawback provision. Many private companies boomed and added the Jobkeeper subsidy to a fully franked dividend for shareholders (it certainly didn’t go the nonparticipating employees!). Some publicly-listed companies were shamed into repaying Jobkeeper.
RBA will eventually figure that NAIRU is less than 4% and start cutting the cash rate. Hopefully sooner rather than later, unless you are cheering for a Dutton minority government in 6 months from now.
What will it take to break out of the current uni-party subservience to mainstream economic theory and austerity politics?
History tells us that major changes in economic policy have occurred because visionary leaders have put forward bold ideas and carried colleagues and voters with them, overcoming conservative influence.
Shortly after Federation an American immigrant, King O’Malley persuaded the newly formed Australian Labor Party to emulate Alexander Hamilton and establish an independent system of finance whereby the Australian government could access credit independent from the Bank of England or private banks.
Through the creation of the Commonwealth Bank, development was enhanced and Australia successfully financed its war effort without incurring foreign debt.
Between the wars a swift and savage conservative reaction severely eroded the effectiveness of the bank by the apointment of a board of business representatives, and austerity was imposed on Australia as the only solution to the depression.
A subsequent inquiry found in 1937 that the Commonwealth Bank (then incorporating the Reserve Bank) must ultimately answer to the elected government. Armed with this mandate the Curtin and Chifley governments were able to steer Australia through the Second World War and subsequently restore the original Commonwealth Bank powers to rebuild the country in peacetime with measures including full employment, affordable housing and development of farms and businesses.
Unfortunately conservative forces and banking interests were again able to convince voters that having government steer the country on their behalf without commercial banks profiting almost at will was somehow evil. The Whitlam Labor government tried to buy back Australian control of the country’s vast mineral resources with finance from the Commonwealth Bank but was thwarted by a hostile Senate, and ultimately by foreign intervention.
Today after more than four decades of neoliberalism and notwithstanding the possibilities inherent in our modern fiat currency we have both Government and Opposition routinely putting corporate opportunity ahead of the national interest, attracting very little criticism.
A mass awareness of MMT is unlikely until mainstream economic theory dies a natural death, but I don’t believe it is necessary. Most voters opinions are shaped by the influence of a relative minority who engage with issues and influence others.
I like to imagine what positive change a future leader with the ability of a young Paul Keating might be able to implement armed with an understanding of MMT and some similarly qualified supporters. When such a figure emerges it will certainly be interesting!
`Thanks Bill for your blog, your “Excellent Adventure” with Warren, and the Manga cartoon, all very much appreciated.