Today (June 3, 2026), the Australian Bureau of Statistics (ABS) released the latest - Australian…
Australia’s growth rate declines further and danger of recession increases on the back of the policy squeeze
Today (March 6, 2024), the Australian Bureau of Statistics released the latest – Australian National Accounts: National Income, Expenditure and Product, December 2023 – which shows that the Australian economy grew by just 0.2 per cent in the December-quarter 2023 and by 1.5 per cent over the 12 months (down from 2.1 per cent). If we extend the September result out over the year then GDP will grow by 0.8 per cent, well below the rate required to keep unemployment from rising. GDP per capita fell for the third consecutive quarter and was 1 per cent down over the year. This is a rough measure of how far material living standards have declined but if we factor the unequal distribution of income, which is getting worse, then the last 12 months have been very harsh for the bottom end of the distribution. Households cut back further on consumption expenditure growth. Moreover, there is now a very real possibility that Australia will enter recession in the coming year unless there is a change of policy direction. Both fiscal and monetary policy are squeezing household expenditure and the contribution of direct government spending, while positive, will not be sufficient to fill the expanding non-government spending gap. At the current growth rate, unemployment will rise. And that will be a deliberate act from our policy makers.
The main features of the National Accounts release for the December-quarter 2023 were (seasonally adjusted):
- Real GDP increased by 0.2 per cent for the quarter (down from 0.3 per cent last quarter). The annual growth rate was 1.5 per cent (down from 2.1) per cent but the annualised December-quarter rate would only be 0.8 per cent
- GDP per capita fell by 0.3 per cent for the quarter, the third consecutive quarter of contraction. Over the year, the measure was down 1 per cent – signalling declining average income.
- Australia’s Terms of Trade (seasonally adjusted) rose by 2.2 per cent for the quarter but were down by 3.9 per cent over the 12 month period.
- Real net national disposable income, which is a broader measure of change in national economic well-being, rose by 1.4 per cent for the quarter and 1.6 per cent over the 12 months, which means that Australians are better off (on average) than they were at that point 12 months ago. Averages are deceiving when the underlying distribution is highly skewed.
- The Household saving ratio (from disposable income) rose to 3.2 per cent from 1.9 per cent.
Overall growth picture – growth continues at much slower rate
The ABS – Media Release – said that:
Australian gross domestic product (GDP) rose 0.2 per cent … in the December quarter and by 1.5 per cent since December 2022 …
Growth was steady in December, but slowed across each quarter in 2023 … Government spending and private business investment were the main drivers of GDP growth this quarter.
The short story:
1. Non-government spending is very weak.
2. The small growth increase in the December-quarter was largely driven by government spending and business investment.
3. Households are being squeezed by the cost-of-living increases and the RBA rate hikes, and the latter, is in part, causing the former.
4. Net exports were a positive contributor only because imports fell which reflects weak domestic income growth.
The first graph shows the quarterly growth over the last five years.
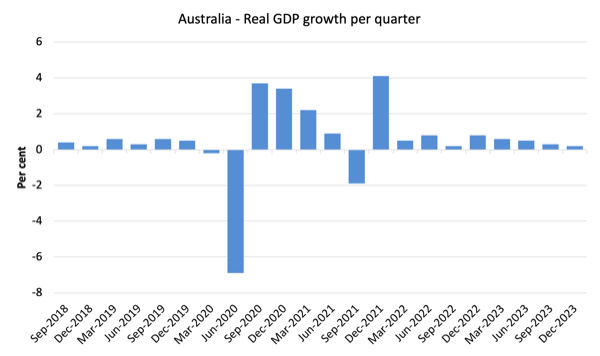
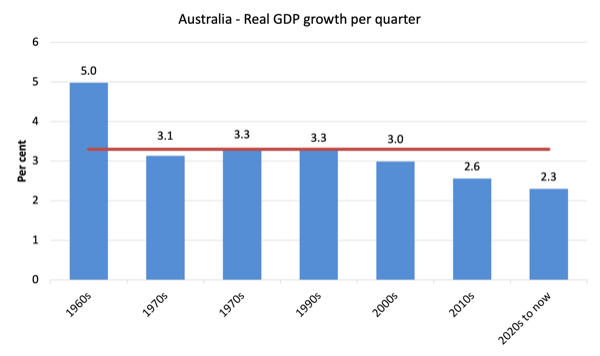
To put this into historical context, the next graph shows the decade average annual real GDP growth rate since the 1960s (the horizontal red line is the average for the entire period (3.26 per cent) from the December-quarter 1960 to the December-quarter 2008).
The 2020-to-now average has been dominated by the pandemic.
But as the graph shows the period after the major health restrictions were lifted has generated lower growth than if we include the period when the restrictions were in place.
It is also obvious how far below historical trends the growth performance of the last 2 decades have been as the fiscal surplus obsession has intensified on both sides of politics.
Even with a massive household credit binge and a once-in-a-hundred-years mining boom that was pushed by stratospheric movements in our terms of trade, our real GDP growth has declined substantially below the long-term performance.
The 1960s was the last decade where government maintained true full employment.
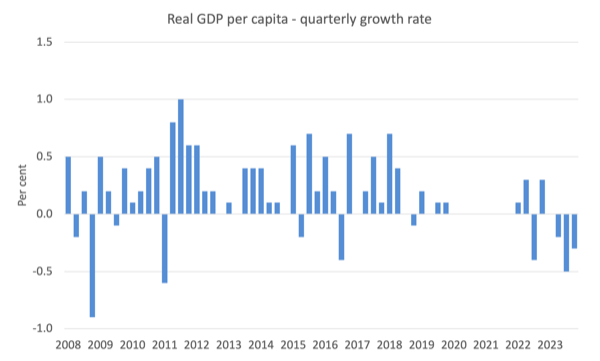
A GDP per capita recession – deepening
GDP per capita fell for the third consecutive quarter, which means that total output averaged out over the entire population contracted for the last 9 months of 2023.
Some consider this to be a deepening recession although what the average actually means is questionable.
With the highly skewed income distribution towards the top end, what we can say if the average is declining, those at the bottom are doing it very tough indeed.
The following graph of real GDP per capita (which omits the pandemic restriction quarters between March-quarter 2020 and December-quarter 2021) tells the story.
Analysis of Expenditure Components
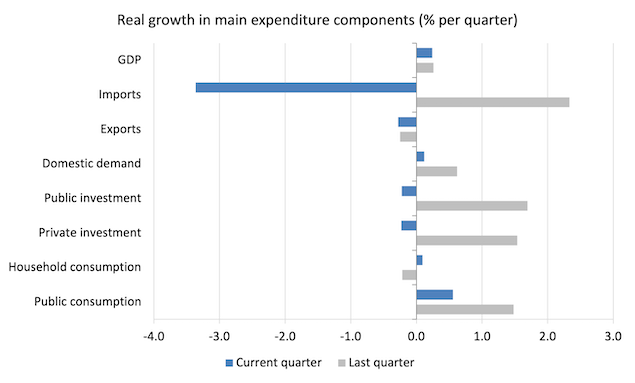
The following graph shows the quarterly percentage growth for the major expenditure components in real terms for the September-quarter 2023 (grey bars) and the December-quarter 2023 (blue bars).
Points to note for the December-quarter:
1. Household Consumption expenditure growth rose by 0.09 per cent (up from -0.21 per cent) – a very subdued period.
2. General government consumption expenditure rose by 0.56 per cent (down from 1.48 per cent).
3. Private investment expenditure growth fell by 0.23 per cent (down from 1.54 per cent).
4. Public investment fell by 0.23 per cent (down from 1.54 per cent) – the strong state and local infrastructure investment is now declining quickly.
5. Export expenditure fell by 0.28 per cent (down from -0.25 per cent). Imports growth fell by 3.36 per cent (up from 2.33 per cent). Remember falling import expenditure adds to growth.
6. Real GDP rose by just 0.24 per cent (down from 0.25 per cent).
Overall: Australia is heading towards recession at this rate – all major components of expenditure growth are weakening or negative.
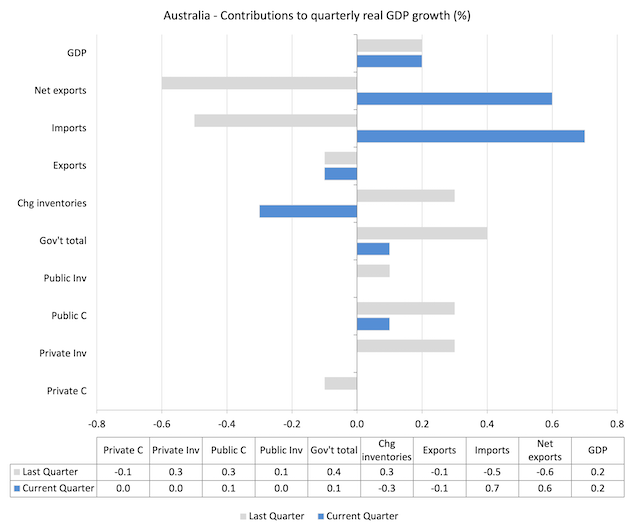
Contributions to growth
What components of expenditure added to and subtracted from the change in real GDP growth in the December-quarter 2023?
The following bar graph shows the contributions to real GDP growth (in percentage points) for the main expenditure categories. It compares the December-quarter 2023 contributions (blue bars) with the previous quarter (gray bars).
In no order:
1. Household consumption expenditure added zero points to the overall growth rate (-0.1 last quarter).
2. Private investment expenditure added zero points (-0.3 last quarter).
3. Public consumption added 0.1 points this quarter (down from 0.3).
4. Public Investment added zero points this quarter (down from 0.1).
5. Overall, the government sector added 0.1 points to growth (down from 0.4).
6. Growth in inventories subtracted 0.3 points (down from 0.3).
7. Net exports added 0.6 points to growth (up from -0.6) with exports (-0.1) being complemented by the fall in imports (+0.7 points) – remember imports are a drain on expenditure.
So we have the parlous situation where the contraction in imports, which reflects a weakening domestic income situation is reducing the shift into overall negative growth.
The rise in inventories was driven by what the ABS said:
Change in inventories fell $2.7 billion in the December quarter, detracting 0.3 percentage points from GDP growth. Strong international demand for commodities like iron ore and coal drove the run down in mining inventories, while a reduced grain harvest resulted in a run down in wholesale inventories.
The fall in goods imports also contributed to the fall in wholesale and retail inventories as businesses did not replenish stock levels during the quarter.
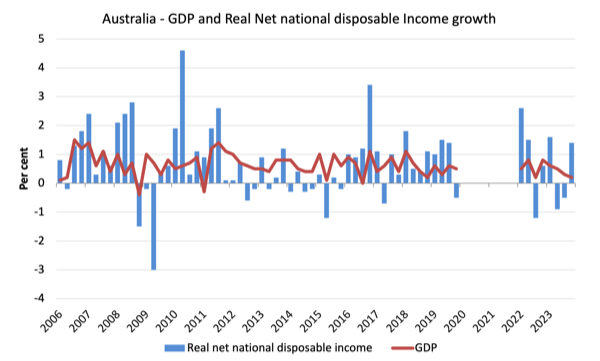
Material living standards rose in December-quarter
The ABS tell us that:
A broader measure of change in national economic well-being is Real net national disposable income. This measure adjusts the volume measure of GDP for the Terms of trade effect, Real net incomes from overseas and Consumption of fixed capital.
While real GDP growth (that is, total output produced in volume terms) rose by 0.2 per cent in the December-quarter, real net national disposable income growth rose by 1.4 per cent.
How do we explain that?
Answer: The terms of trade rose by 2.2 per cent in the December-quarter and by 9 per cent for the 12 months to September. This largely boosted mining sector profits.
Household saving ratio rose by 1.3 points to 3.2 per cent
The ABS noted that:
Following eight quarters of falls, the household saving to income ratio rose to 3.2 per cent, with income received by households outpacing their income paid.
… Compensation of employees and government payments were the drivers of the increase in income received by households in December. Government payments were raised with increases to the base rates of payments across a variety of benefits such as JobSeeker and youth allowance; an increase in commonwealth rent assistance; and the standard indexation of benefits that occurs in late September ….
So increases in government assistance helped stem the dramatic drop in the household saving ratio.
The RBA has been trying to wipe out the household saving buffers as it hiked interest rates hoping that this would reduce the likelihood of recession.
Of course, that process has attacked the lower-end of the wealth and income distribution, given the rising interest rates have poured millions into those with interest-rate sensitive financial assets.
The following graph shows the household saving ratio (% of disposable income) from the December-quarter 2000 to the current period. It shows the period leading up to the GFC, where the credit binge was in full swing and the saving ratio was negative to the rise during the GFC and then the most recent rise.
The current position is that households are being squeezed by a combination of rising living costs and interest rates and low wages growth, which up until the December-quarter was driving a gap between income and expenditure.
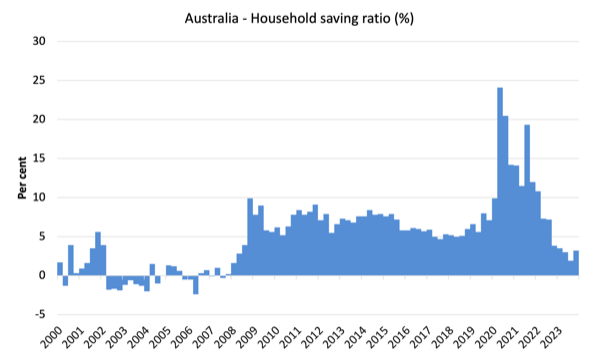
Going back to the pre-GFC period when the household saving ratio was negative and consumption growth was sustained by increasing debt – which is a strategy that is not sustainable, given that household debt so high.
Households will continue to cut back on consumption spending and that will drive the economy towards recession.
It will be a deliberate act of sabotage engineered by the RBA.
The following table shows the impact of the neoliberal era on household saving. These patterns are replicated around the world and expose our economies to the threat of financial crises much more than in pre-neoliberal decades.
The result for the current decade (2020-) is the average from June 2020.
| Decade | Average Household Saving Ratio (% of disposable income) |
| 1960s | 14.4 |
| 1970s | 16.2 |
| 1980s | 11.9 |
| 1990s | 5.0 |
| 2000s | 1.4 |
| 2010s | 6.7 |
| 2020s on | 10.4 |
| Since RBA hikes | 3.8 |
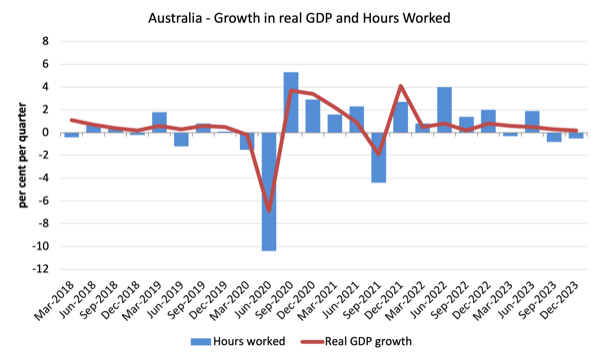
Real GDP growth rose but hours worked fall – thus GDP per hour worked rises
Real GDP rose 0.2 points in the quarter, while working hours fell 0.5 per cent.
Which means that GDP per hour worked rose by 0.52 points for the quarter – that is, an increase in labour productivity.
That reduced the annual slide in productivity growth to -0.52 per cent
The following graph presents quarterly growth rates in real GDP and hours worked using the National Accounts data for the last five years to the December-quarter 2023.
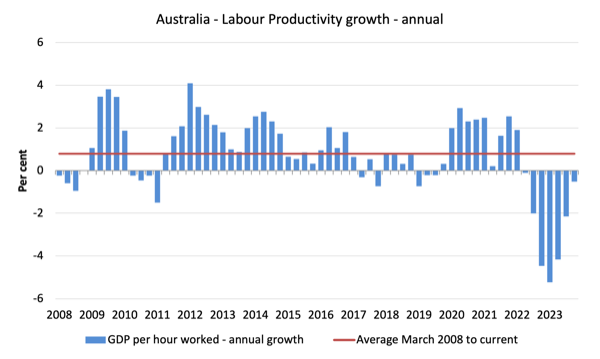
To see the above graph from a different perspective, the next graph shows the annual growth in GDP per hour worked (labour productivity) from the March-quarter 2008 quarter to the December-quarter 2023.
The horizontal red line is the average annual growth since March-quarter 2008 (0.79 per cent), which itself is an understated measure of the long-term trend growth of around 1.5 per cent per annum.
The relatively strong growth in labour productivity in 2012 and the mostly above average growth in 2013 and 2014 helps explain why employment growth was lagging given the real GDP growth. Growth in labour productivity means that for each output level less labour is required.
GDP per hours worked has now fallen for the last six quarters – a poor outcome.
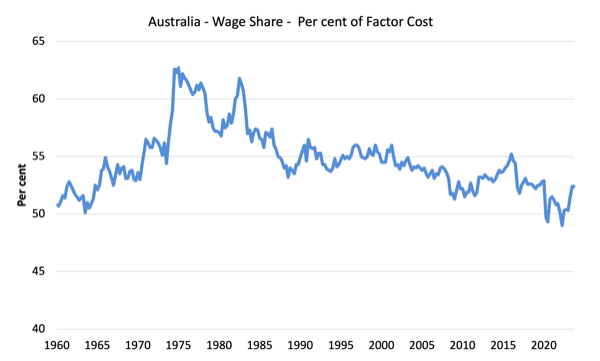
The distribution of national income – wage share steady
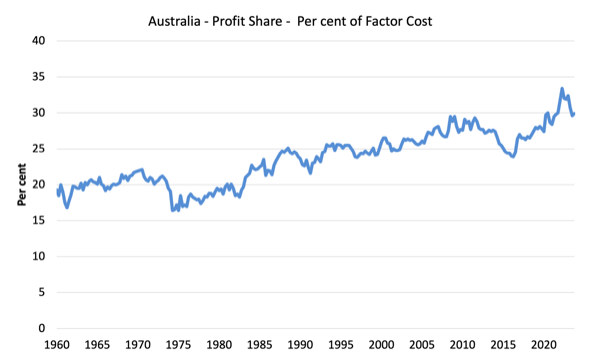
The wage share in national income rose slightly to 52.4 per cent while the profit share rose to 29.9 per cent. The profit share rose as a result of a rise in the terms of trade which boosted profits in the mining sector.
But as the following graphs show, this shift is minor in the face of the recent trends.
The first graph shows the wage share in national income while the second shows the profit share.
The declining share of wages historically is a product of neoliberalism and will ultimately have to be reversed if Australia is to enjoy sustainable rises in standards of living without record levels of household debt being relied on for consumption growth.
Conclusion
Remember that the National Accounts data is three months old – a rear-vision view – of what has passed and to use it to predict future trends is not straightforward.
The data tells us that after the initial rebound from the lockdowns, growth has now stalled at well below the trend rate.
Moreover, there is now a very real possibility that Australia will enter recession in the coming year unless there is a change of policy direction.
Both fiscal and monetary policy are squeezing household expenditure and the contribution of direct government spending, while positive, will not be sufficient to fill the expanding non-government spending gap.
At the current growth rate, unemployment will rise.
And that will be a deliberate act from our policy makers.
That is enough for today!
(c) Copyright 2023 William Mitchell. All Rights Reserved.
One policy aspect not covered to avoid a technical recession is immigration. Currently circa 600k pa, juice the ponzi scheme bring in 1m “skills shortage” extra bods = extra GDP too bad the homeless situation thats the states problem. Thus good economic managers problem solved. Capital happy, oligarchs happy too bad the 99%, they follow what they are told via the manufactured consent. So no Australia does not have a recession. The cure is much worse than the ailment but dont be surprised the lever pulled by our political masters to avert recession. Per capita it will be a horrible recession but that does not get promited in the media.