The recent extreme weather in the northern hemisphere, the twin monster tropical storms in Japan,…
Be careful using first release data – Britain now surges ahead of Europe!
In May 2023, when the British Office of National Statistics (ONS) released the March-quarter national accounts data (first estimate), which showed that real GDP grew by only 0.1 per cent in the first quarter and a rate equal to the December-quarter 2022, the critics were out in force. Brexit this. Brexit that. Graphs were created showing that Britain was recording the worst growth across the G7 nations. Brexit this. Brexit that. The Labour Party was cock-a-hoop as they continued the purge of the progressive elements in the Party. Then the second estimate came out on June 30, 2023 using additional data which the ONS said provides ‘a more precise indication of economic growth than the first estimate’, we learned that GDP “increased by an unrevised 0.1% in Quarter 1”. Brexit this. Brexit that. William Keegan who is like a cracked record stuck in a rut, wrote more UK Guardian articles bemoaning the democratic choice to leave the European Union. The problem is that all this data-centric inference was based on an illusion, which is why one must always be circumspect when dealing with this sort of data. The latest national accounts data released by the ONS on Friday (September 29, 2023) revised the first quarter result – scaling it up by a factor of three – to 0.3 per cent, which is still slow but hardly the disaster the pundits claimed.
The latest ONS data – GDP quarterly national accounts, UK: April to June 2023 – tells us that:
1. “UK gross domestic product (GDP) is estimated to have increased by an unrevised 0.2% in Quarter 2 … 2023”.
2. “UK GDP is now estimated to have increased by 0.3% in Quarter 1 (Jan to Mar) 2023, revised up from a previous estimate of 0.1%”.
3. “growth in the latest quarter was driven by a 1.2% increase in the production sector, where there were increases in 9 out of the 13 sub-sectors”.
4. “The household saving ratio grew by 9.1% in the latest quarter, up from 7.9% in Quarter 1 2023, with income (driven by a rise in social benefits together with increased wages and salaries) growing more than expenditure.”
5. “Real households’ disposable income (RHDI) grew by 1.2% in Quarter 2 (Apr to June) 2023 following no change in the previous quarter.”
6. “UK GDP is now estimated to have increased by 4.3% in 2022, revised from a first estimate of 4.1%.”
7. “GDP is now estimated to be 1.8% above pre-coronavirus (COVID-19) pandemic levels in Quarter 2 (Apr to June) 2023.”
The ONS say that the significant revision to the first-quarter result is, in part, due to “improved source data and additional updated data”.
They also noted that the “revisions were larger than normal, reflecting … the practical challenges of estimating GDP throughout the … pandemic”.
So if we put all that together I wouldn’t be issuing disaster statements just yet.
But we can look a little further.
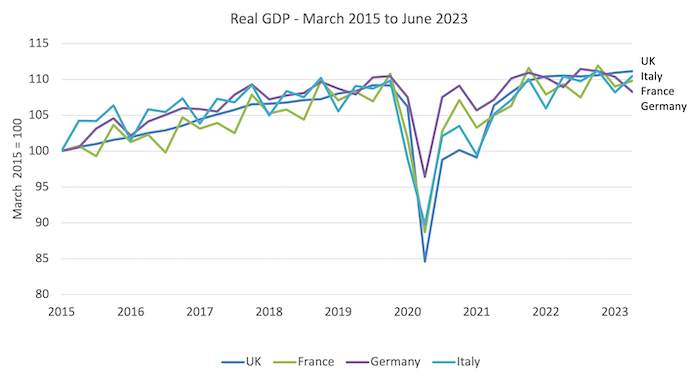
The following graph shows the situation for the UK, France, Germany and Italy since the March-quarter 2015 (so covers the entire post 2016 Referendum period plus a bit.
It is clear that the UK was harder hit by the pandemic and has now recovered better – in growth terms – than the three large European Union economies.
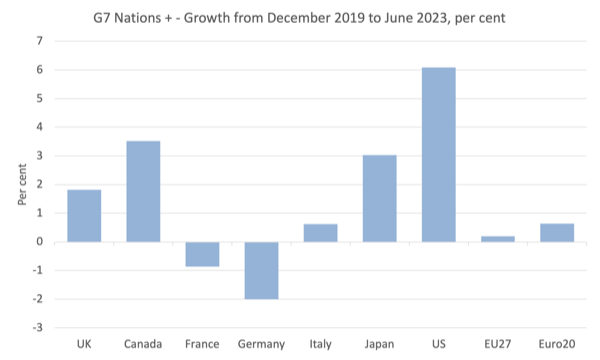
We can see that from another angle – the next graph shows the growth between the December-quarter 2019 (the pre-pandemic quarter) to the June-quarter 2023 for the G7 nations (UK, Canada, France, Germany, Italy, Japan, the US, with the EU as an enumerated member). I also included the Eurozone aggregate.
Whichever way you want to say it – the claims earlier in the year based on preliminary national accounts data that Britain was at the bottom of the G7 heap when it comes to economic growth and recovery since the pandemic were uniformly false.
By comparison with the major European economies, Britain looks okay.
I know economic growth is not necessarily the best way to just economic performance.
But the aim here is not to debate preferable measures of societal and environmental well-being.
Rather, I am interested in meeting the claims that have been made by those who still hold the European Union out as a desirable organisation to be part of.
Further, as usual, we are discussing aggregates here and I know that at the micro level, where humans live and work, the decision to exit the European Union has been discomforting and downright inconvenient for some British people.
A structural shift as large as it was will always create winners and losers.
But again, my aim is to address the broad claims not try to pretend that large scale structural change isn’t damaging to some.
On the Brexit issue at a macro level, if being part of the European Union was such a bonus because of proximity to trade routes and the like, and recognising that the majority of trade by European nations is intra rather than beyond EU borders, then one would expect the larger European economies to be doing better than Britain at this stage.
They are not and the trade powerhouse of Europe, Germany, is doing the worst of the three large economies.
Even so, the likes of the UK Guardian’s Keegan still make out that the EU is a trade nirvana for Britain despite the poor performance of the major European economies.
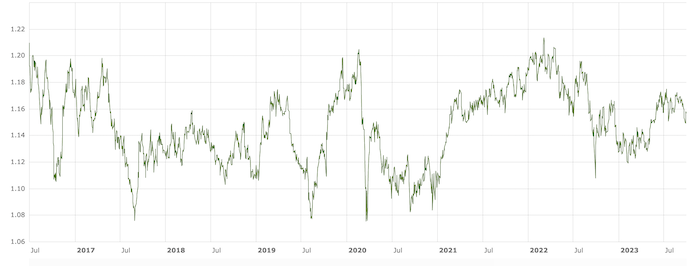
He also regularly claims that there has been a massive depreciation of the pound against the euro.
He wrote on June 25, 2023 that: “the referendum was followed by a dramatic fall in the pound, which raised all import prices, not least food from the EU” (Source).
This is typical of his assertions.
Well how we view the exchange rate movements depends on what we mean by dramatic and when we choose to measure it between.
Here is the pound against the euro since July 1, 2016 (just after the Referendum).
No dramatic irreversible depreciations going on there.
Some variation but constantly returning to the level.
A closer look at the revised data
The following graph shows the annual and quarterly growth from the March-quarter 2005 to the June-quarter 2023.
I left the pandemic period out (March-quarter 2020 to March-quarter 2022) because it distorts the rest of the data.
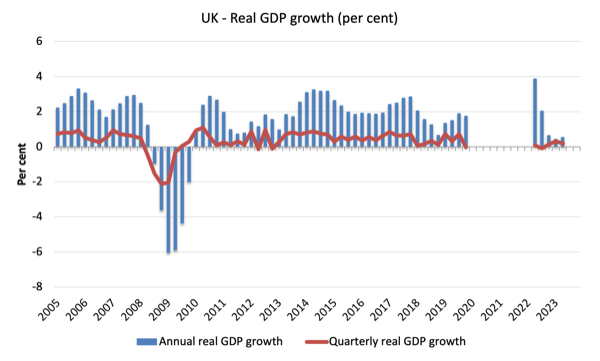
Clearly the most recent three quarters indicate very low growth notwithstanding what I wrote above.
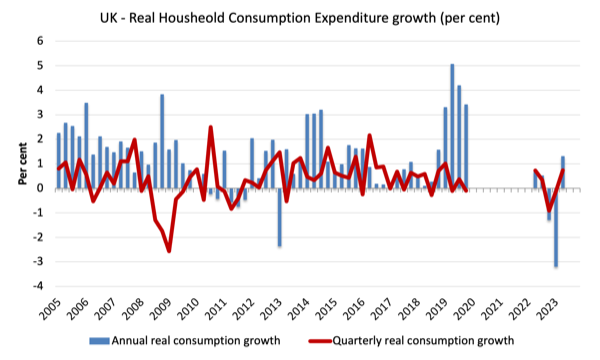
The following graph shows the annual and quarterly growth in household consumption expenditure (real terms) since the March-quarter 2005.
The June-quarter saw a rebound which was also accompanied by increased government spending.
Household consumption expenditure was boosted by spending on Tourism.
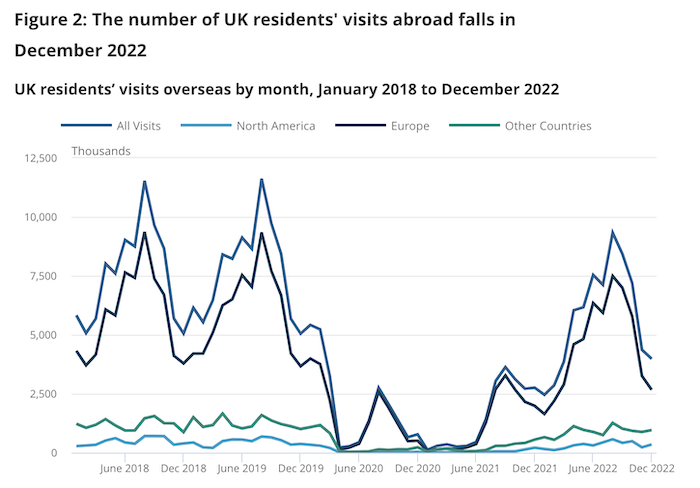
I thought this was another interesting statistic given the claims by the Anti-Brexit crowd who complain of diabolical impediments to travel as a result of the border changes.
The most recent data on overseas travel and tourism came out on July 20, 2023 – Overseas travel and tourism: December 2022 provisional results.
Here is an ONS graph of UK residents travelling abroad.
It is hard to see any other impact bar the pandemic at work here and the rising interest rates which are squeezing purchasing power.
One might interpret the pre-pandemic decline as a Brexit disturbance and it well could have been as adjustments were made.
But then you also have to interpret the post pandemic boom in a strange way.
Conclusion
Overall I still cannot see a major macroeconomic impact coming from Britain’s exit from the European Union.
The Remainers are now hanging on to the inflation differentials between Britain and Europe as evidence.
I will write more about that another day.
That is enough for today!
(c) Copyright 2023 William Mitchell. All Rights Reserved.
Hi Bill,
The ONS blog, from 3 days ago, says –
“It is worth noting that many other economies are going through the same process of reviewing and updating their economic data as new more complete information becomes available, with several others reporting revisions of a similar scale. Our estimates for growth increased by +1.1 percentage points for 2021, while Spain also increased its by +1.1 percentage points, the Netherlands by +1.3, and Italy also by +1.3.”
https://blog.ons.gov.uk/2023/09/29/gdp-bringing-the-big-picture-up-to-date/
Have your comparisons taken account of the +1.3 revision for Italy?
Question: If the GDP has remained constant, yet the ‘Money supply’ (M4ex that the BoE likes to use) has fallen, doesn’t that mean that the ‘velocity’ has just gone up to compensate?
There are a lot of latent Monetarists creeping out of the woodwork at the moment waving their lagged money supply graphs around in front of anybody who will listen. We need another reason to laugh in their face.
As to inflation differentials, plotting Japanese PPI vs UK PPI rebased to Jan 2021 is interesting. The paths diverge very shortly after the change in UK monetary policy stance in December 2021.
Dear George S. Gordon (at 2023/10/02 at 10:14 pm)
I took the latest Eurostat data, which is the most recent that is publicly available. Whether there are more revisions to come for Italy or the other EU Member States in the next release I cannot say yet.
best wishes
bill
Having just returned from holiday in France I can only make a subjective assessment of cost of living there compared to the UK. It’s certainly not the utopia than Keegan and others in the ‘echo chamber’ claim. Food and motor fuel prices are certainly much higher than in the summer of 2022 and higher than UK prices. I am puzzled as to what is actually going on here. I should state that my entire family voted to Remain but since not being in the EU doesn’t affect my ability to spend time there I really think we should get on with making the best of the decision.
The EU is good for the 1%, the reason for the bemoaning of their mouthpieces about brexit.
It is possible for the Brits to be a healthier society than the rest of europe?
It is possible for the EU to walk towards neo-feudalism, while the Brits move in the opposite direction?