Over the last several years, I have been indicating that I think we are in…
US labour market – unemployment rises on back of rising participation rate
Last Friday (September 1, 2023), the US Bureau of Labor Statistics (BLS) released their latest labour market data – Employment Situation Summary – August 2023 – which showed payroll employment rising by 187,000 but also that the unemployment rate has now starting rising (up 0.3 points) to 3.8 per cent. Is this the tipping point? I am very uncertain given the surprisingly large burst in participation which accounts almost entirely for the rise in unemployment and the unemployment rate. Most of the other aggregates were relatively stable which is why I am expressing uncertainty in my assessment. However, there is no sign of recession and no sign that the misguided Federal Reserve interest rate rises are causing rises in unemployment. Powell could hardly take credit for the rising participation rate unless he argued that he had created such desperation that people who normally do not work sought work. A stretch!
Overview for August 2023 (seasonally adjusted):
- Payroll employment increased by 187,000 (up from 157,000 last month).
- Total labour force survey employment rose by 222 thousand net (0.17 per cent).
- The labour force rose 736 thousand net (0.44 per cent) – I suspect this figure will be revised down next month – it is a very large increase.
- The participation rate rose 0.2 points to 62.8 per cent.
- Total measured unemployment rose by 514 thousand to 6,355 thousand – all due to the rise in participation.
- The official unemployment rate rose by 0.3 points to 3.8 per cent.
- The broad labour underutilisation measure (U6) rose 0.4 points to 7.1 per cent – largely because of the rise in unemployment.
- The employment-population ratio was unchanged at 60.4 per cent (still well below the June 2020 peak of 61.2).
For those who are confused about the difference between the payroll (establishment) data and the household survey data you should read this blog post – US labour market is in a deplorable state – where I explain the differences in detail.
Some months the difference is small, while other months, the difference is larger.
Payroll employment trends
The BLS noted that:
Total nonfarm payroll employment increased by 187,000 in August, less than the average monthly gain of 271,000 over the prior 12 months …
In August, health care added 71,000 jobs, following a gain of similar magnitude in the prior month …
Employment in leisure and hospitality continued to trend up in August (+40,000). The industry had gained an average of 61,000 jobs per month over the prior 12 months. Employment in the industry remains below its pre-pandemic February 2020 level by 290,000, or 1.7 percent.
Employment in social assistance increased by 26,000 in August, in line with the prior 12-month average gain (+22,000) …
Construction employment continued to trend up in August (+22,000), in line with the average monthly gain over the prior 12 months (+17,000) …
Transportation and warehousing lost 34,000 jobs in August … Employment in transportation and warehousing had shown little net change over the prior 12 months.
Employment in professional and business services changed little in August (+19,000) and has shown essentially no net change since May …
Information employment changed little in August (-15,000).Employment showed little change over the month in other major industries …
In summary, January 2023 yielded 472 thousand net payroll jobs and that shift has now declined over the last 3 months.
While there is no sign of an impending recession average monthly job creation in net terms is well down on 2022.
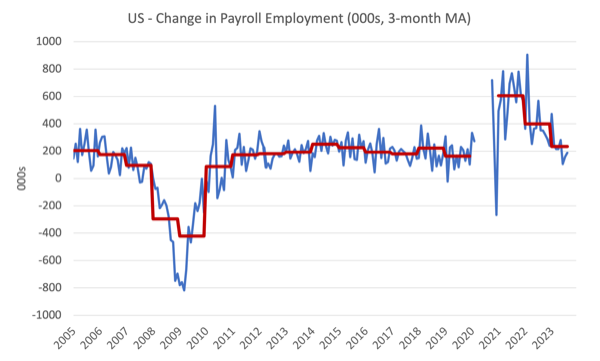
The first graph shows the monthly change in payroll employment (in thousands, expressed as a 3-month moving average to take out the monthly noise). The red lines are the annual averages. Observations between January 2020 and January 2020 were excluded as outliers.
You can see a distinct slowdown over the last two years back to pre-pandemic behaviour after the surge after the initial Covid restrictions.
The next graph shows the same data in a different way – in this case the graph shows the average net monthly change in payroll employment (actual) for the calendar years from 2005 to 2023.
The red marker on the column is the current month’s result.
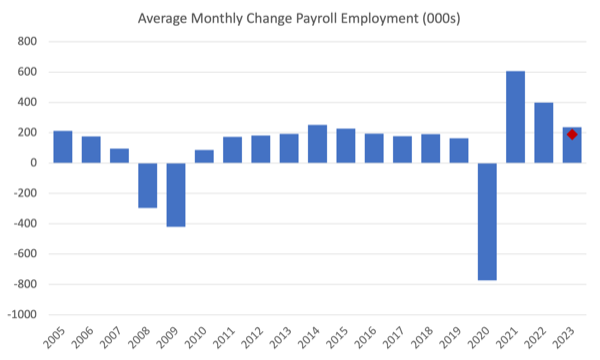
Average monthly change – 2019-2023 (000s)
| Year | Average Monthly Employment Change (000s) |
| 2019 | 163 |
| 2020 | -774 |
| 2021 | 606 |
| 2022 | 399 |
| 2023 (so far) | 236 |
Labour Force Survey data – employment up 222 thousand but unemployment rises on increasing participation
The seasonally-adjusted data for August 2023 reveals:
1. Total labour force survey employment fell by 222 thousand net (0.14 per cent) – slightly down on last month.
2. The labour force rose massively by 736 thousand net (0.44 per cent).
3.The participation rate rose by 0.2 points to 62.8 per cent.
4. As a result (in accounting terms), total measured unemployment rose by 514 thousand to 6,355 thousand and the official unemployment rate rose by 0.3 points to 3.8 per cent.
It remains to be seen whether participation change is a sampling aberration. We will see next month if revisions are made.
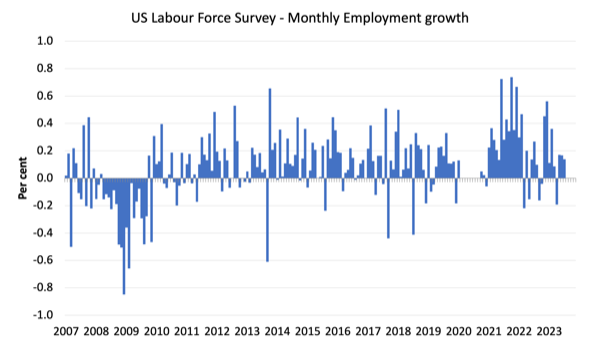
The following graph shows the monthly employment growth since January 2008 and excludes the extreme observations (outliers) between August 2020 and January 2020, which distort the current period relative to the pre-pandemic period.
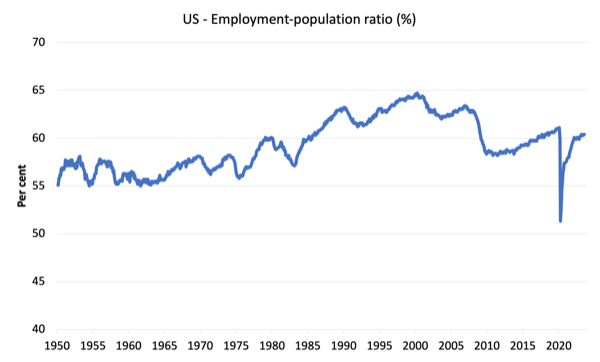
The Employment-Population ratio is a good measure of the strength of the labour market because the movements are relatively unambiguous because the denominator population is not particularly sensitive to the cycle (unlike the labour force).
The following graph shows the US Employment-Population from January 1950 to August 2023.
In August 2023, the ratio was unchanged at 60.4 per cent.
The peak level in August 2020 before the pandemic was 61.1 per cent.
Unemployment and underutilisation trends
The BLS note that:
The unemployment rate rose by 0.3 percentage point to 3.8 percent in August, and the number of unemployed persons increased by 514,000 to 6.4 million. Both measures are little different from a year earlier, when the unemployment rate was 3.7 percent and the number of unemployed persons was 6.0 million. …
Both the number of persons unemployed less than 5 weeks, at 2.2 million, and the number of long-term unemployed (those jobless for 27 weeks or more), at 1.3 million, edged up in August. The long-term unemployed accounted for 20.3 percent of all unemployed persons. …
The number of persons employed part time for economic reasons, at 4.2 million, changed little in August. These individuals, who would have preferred full-time employment, were working part time because their hours had been reduced or they were unable to find full-time jobs.
So the major shift was the increase in unemployment as a result of a surge in the labour force participation rate.
The odd thing is that the employment-population ratio didn’t shift at all. So employment kept pace with the underlying population growth but a higher proportion of the working age sought work.
The first graph shows the official unemployment rate since January 1994.
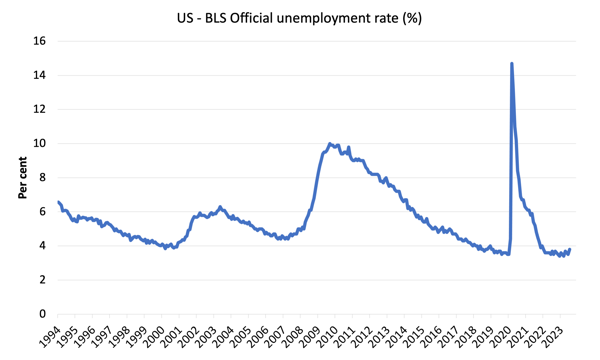
The official unemployment rate is a narrow measure of labour wastage, which means that a strict comparison with the 1960s, for example, in terms of how tight the labour market, has to take into account broader measures of labour underutilisation.
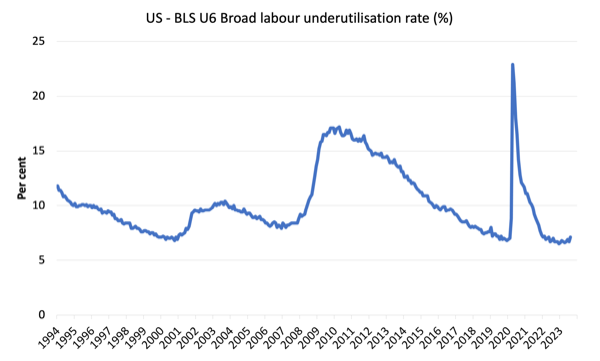
The next graph shows the BLS measure U6, which is defined as:
Total unemployed, plus all marginally attached workers plus total employed part time for economic reasons, as a percent of all civilian labor force plus all marginally attached workers.
It is thus the broadest quantitative measure of labour underutilisation that the BLS publish.
Pre-COVID, U6 was at 6.8 per cent (January 2019).
In August 2023 the U6 measure was 7.1 per cent up 0.4 points – mostly because of the rise in unempmloyment.
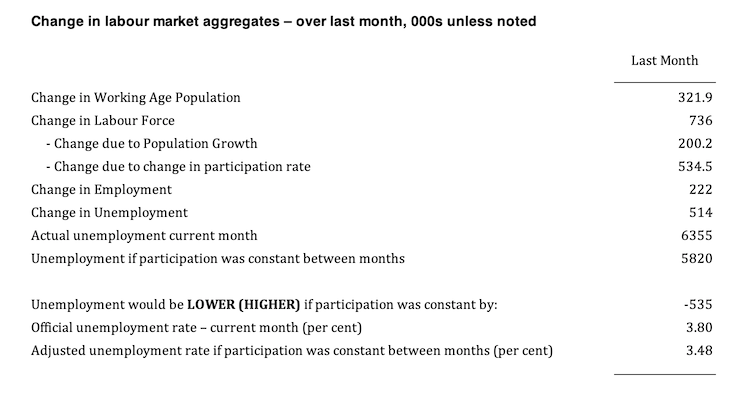
How has rising participation impacted the monthly result?
The following table shows the impact of the rising participation rate on the unemployment rate.
We can conclude that had the participation rate not risen by 0.2 points, the unemployment rate would have been unchanged.
The monthly employment change (222 thousand) just outstripped the growth in the labour force arising from underlying population growth (200.2 thousand).
However, the rising participation rate added 534.5 thousand workers who needed to find work and that accounts for the rise in unemployment of 514 thousand.
I suspect this is a statistical aberration but we will see next month if there are revisions.
What about wages growth in the US?
The BLS reported that:
In August, average hourly earnings for all employees on private nonfarm payrolls rose by 8 cents, or 0.2 percent, to $33.82. Over the past 12 months, average hourly earnings have increased by 4.3 percent. In August, average hourly earnings of private-sector production and nonsupervisory employees rose by 6 cents, or 0.2 percent, to $29.00.
The latest – BLS Real Earnings Summary – July 2023 (published August 10, 2023) – tells us that:
Real average hourly earnings for all employees increased 0.3 percent from June to July, seasonally adjusted … This result stems from an increase of 0.4
percent in average hourly earnings combined with an increase of 0.2 percent in the Consumer Price Index for All Urban Consumers (CPI-U).Real average weekly earnings were essentially unchanged over the month …
Real average hourly earnings increased 1.1 percent, seasonally adjusted, from July 2022 to July 2023.
With moderating inflation, nominal wages growth is now delivering modest real wage increases.
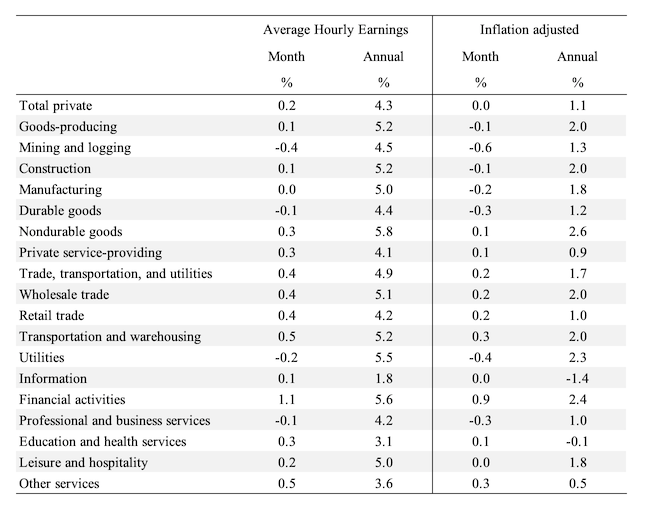
The following table shows the movements in nominal Average Hourly Earnings (AHE) by sector and the inflation-adjusted AHE by sector for August 2023 (note we are adjusting using the July CPI – the latest available).
Some sectors, however, are still not enjoying the modest real wage gains enjoyed elsewhere.
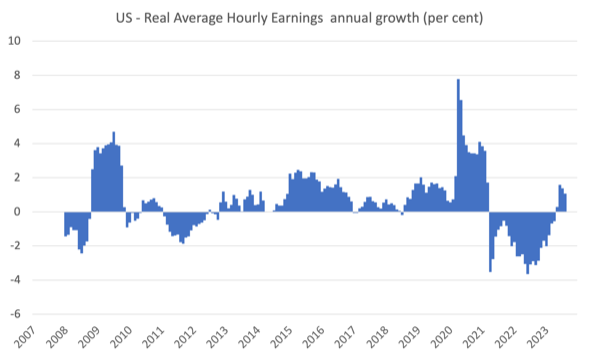
The following graph shows annual growth in real average hourly earnings from 2008 to August 2023.
The other indicator that tells us whether the labour market is turning in favour of workers is the quit rate.
The most recent BLS data – Job Openings and Labor Turnover Summary (released August 29, 2023) – shows that:
The number of job openings edged down to 8.8 million on the last business day of July … Over the month, the number of hires and total separations changed
little at 5.8 million and 5.5 million, respectively. Within separations, quits (3.5 million) decreased, while layoffs and discharges (1.6 million) changed little. …In July, the number of quits decreased to 3.5 million (-253,000), while the rate changed little at 2.3 percent.
So in July 2023, the quit rate continued to fall and job openings also started to contract.
A sign that the turning point may have been reached.
Conclusion
In August 2023, the latest US labour market data suggested that a tipping point may have finally been reached although there is uncertainty given the surprisingly large burst in participation which accounts almost entirely for the rise in unemployment and the unemployment rate.
Most of the other aggregates were relatively stable which is why I am expressing uncertainty in my assessment.
That is enough for today!
(c) Copyright 2023 William Mitchell. All Rights Reserved.
Temps and weekly hours are the first to go. Per capita temp employment rolled over several months ago (albeit from a very high level). Manufacturing hours remain around post-pandemic lows.
Side note: The red line in the Change in Payroll Employment graph appears to be an annual average that resets yearly, rather than a 3 month MA (which would be a smooth line).