The editorial in The Japan Times (July 3, 2026) - Little hope for a declining…
Fiscal policy shifts, not rising interest rates are required at present
Yesterday, I commented on Tuesday’s RBA interest rate rise. I wasn’t complementary. In the last two days, more data has been released since the decision, which further suggests that the RBA erred. It also suggests that part of the housing problem everyone is focused on is not due to lax monetary policy, which is the mainstream mantra, but is, rather, due to flawed tax policy. So, we have seen housing loan demand in decline and building approvals plummetting in the last month, a sign that the housing market, especially for owner-occupiers is in decline. Further, the growth in retail sales was only 1.6 per cent, and while mainstream economists are pointing to the rapid growth over the 12-month period (9.4 per cent March to March), they ignore the fact that the the March 2022 observation shows a decline on the previous month. The RBA statement yesterday did not mention housing at all, even though its decision has already pushed up mortgage rates in an already declining market. All they seem to want to do is cause massive damage to low income workers through even lower real incomes and rising unemployment and underemployment. There are fiscal options that should be pursued right now but the policy makers appear blind to them.
Housing loans
The latest housing loan data released on Wednesday (May 4, 2022) – Lending indicators – for March 2022, shows that:
“The value of new loan commitments” rose 1.6 per cent for housing, fell 0.4 per cent personal loans, rose 23.6 per cent for business construction and fell 16.8 per cent for business property purchases.
The latter two components are very volatile.
Focusing on the housing commitments, we find that:
– for owner-occupier housing rose 0.9% to $21.6b and was 2.2% lower compared to a year ago.
– for investor housing rose 2.9% to a record high of $11.7b.
The data also shows that the annual growth (March 2021-March 2022) in loan commitments was:
1. Housing 11.1 per cent.
2. Owner-occupied -2.2 per cent.
3. Investment speculation 48.4 per cent.
So, in the last year, the owner-occupied housing market has contracted while those borrowing to take speculative positions in investment properties has sky-rocketed.
The question then is whether interest rate manipulation is the appropriate tool to alter this behaviour.
In Australia, our tax system favours speculative investment in housing (particularly already constructed homes and apartments), which diverts savings away from investment in productive capital formation.
Speculators get massive tax breaks for running their investments at a cash loss (rental income less than costs of running the property) and then cash in on the capital gain down the track.
It is a stupid policy and favours the well-off, many of whom have many investment properties.
It was justified on the basis of improved supply of rental accommodation.
Of course, this has to be seen in the context of federal and state governments dramatically cutting back their investement in social housing – we currently are about 450,000 residential units short in that segment because of the failure of government to invest as they chased fiscal surpluses.
So the rental market became increasingly squeezed (now vacancy rates are very low all over the country) and governments tried to cover their tracks by claiming that providing incentives to investors would make private rental accommodation grow.
The banks who make a killing on the investment loans clapped.
Those who profit from flipping properties clapped.
And we all aspired to own more than the property we live in.
The problem is that the data suggests that while massive profits are being made by these housing speculators (with the tax breaks), the rental market is actually worse off – with higher rents than would otherwise be the case.
The tax policy – negative gearing – allows investors to write off losses (interest costs minus rental income) against their other income sources.
The claim is that this suppresses rental charges because if the investor charges to much rent they will not be able to exploit the tax break.
No evidence is ever advanced to justify this claim.
Indeed, it is clear that investors screw as much rent out of the market as they can, and, then, if that compromises the tax advantage they just take out greater loans and acquire more property.
The other claim is that the supply of housing rises as a result of the tax breaks.
The more accurate observation is that more landlords have entered the picture.
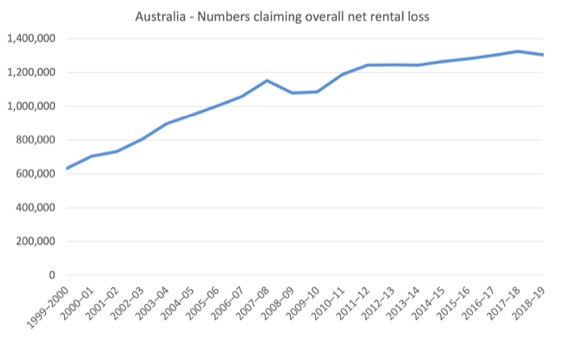
Data from the Australian Tax Office – Snapshot – Table 4 – shows that between 1999-2000 and 2018-19 (latest year available):
1. There was a 106.6 per cent increase in those reporting an overall net rent loss (and therefore claiming the tax break).
2. 73.2 per cent increase in those reporting an overall net rent neutral or profit position.
3. 91.4 per cent increase in those reporting rental income.
The following graph shows the evolution of those claiming losses.
Further, there has been an increase in the multiple property holdings that are claiming net rental losses as shown in the following graph.
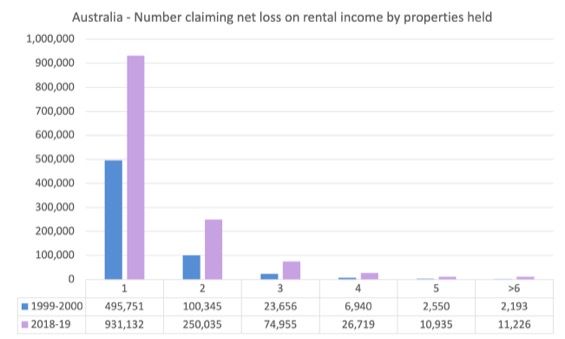
So the number of people who are claiming net rental losses on 6 or more houses has risen from 2,193 to 11,226. As time passes, the distribution is shifting towards having multiple rather than single investment rental properties.
The already wealthier not only increase their speculative investments and gain greater income tax breaks but also build larger wealth holdings over time by exploiting this tax break.
If this was about increasing the supply of new properties (to ease the shortage and increase rental availability) then these investors would be predominantly investing in new construction rather than buying up and gaining from existing stock turnover.
The data released yesterday cited above is clear on that.
Table 13 – breaks the data down into loans for Purchase of newly erec of dwellings and Purchase of existing
This data starts at July 2019, but you can get earlier data from the previous series – HERE – which goes from October 1975 to November 2018.
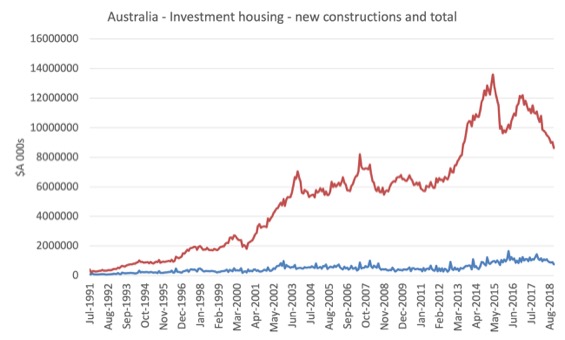
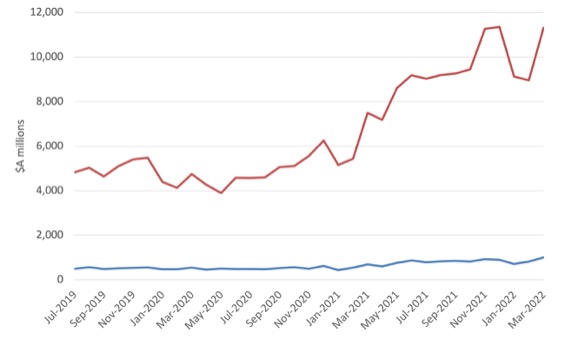
The following graph shows the investment housing (in $A000s) in Construction of new dwellings for rent for rent and resale and the total investment housing value from July 1991 to November 2018 (top panel) and from July 2019 to March 2022 (lower panel).
I produced two graphs because there is a break in the series which is irreconcilable.
But the trend within each is clearly the same.
The proportion of total investment spending has declined from the high 20s in the 1990s to less than 10 per cent by the end of 2018. By December 2021, that proportion was 8.8 per cent only.
Growth in speculative housing expenditure on existing constructions for rental has dramatically outstripped the investment in new housing for rental.
The point is that this doesn’t really expand the supply of housing, just the substitutes the housing stock that would have been purchased by owner occupiers (at lower prices) and turns it into rental accommodation.
That doesn’t expand the rental market because it adds to both supply and demand and in the Australian context has particularly punished the younger age groups who cannot afford to enter the owner-occupier market because of the price escalation, in part, due to these investors competing to buy up the existing housing stock.
The point of all this is that while low interest rates have been blamed for the massive rise in prices in the housing market and that interest rate increases were required to ease the pressure, the reality is that it has been the investment speculation that has dominated demand in the last period and that has been motivated in no small part by the ridiculous tax structure the federal government has in place that rewards this unproductive diversion of national savings.
The owner-occupied segment of the housing market has been in decline over the last 12 months and so using interest rate increases to choke of that segment seems a case of the shutting the gate when the horse has already bolted.
Scrapping the tax breaks on housing speculation and building more social houses would be the more productive way to deal with the housing crisis.
As it is, the speculators have built up so much wealth that they will be able to absorb the interest rate rises and it is far from clear whether there will be any adverse impacts on their demand for existing housing stock.
But for the owner-occupiers and those trying to get into the market as first home buyers, the rate rise will be punitive, given the high entry cost and the low wages growth.
I haven’t seen anything from the RBA researchers dealing with this problem and it wasn’t mentioned in their media statement on Tuesday after they pushed up the interest rate.
Dwelling approvals
To further add evidential support to my claim that the housing market has already cooled, the ABS release today (May 5, 2022 )- Building Approvals, Australia – shows a spectacular decline in approvals over the last month and year.
The data for March 2022 shows:
| Category | Monthly Change (%) | Yearly Change (%) |
| Total dwelling units approved | -18.5 | -35.6 |
| Private sector houses | -3.0 | -32.2 |
| Private sector dwellings excluding houses | -29.9 | -41.0 |
So the construction industry (housing) is also contracting sharply – well before any interest rate rises.
It raises the question as to what exactly is the RBA trying to slow with Tuesday’s interest rate decision.
All the talk has been about housing.
But that is already in decline and the interest rate rise will not really stifle the unproductive investment segment of that market.
We are left with the conclusion that the RBA thinks the economy is growing too fast overall and so they want to damage spending across the board and create income losses and a rise in mass unemployment and underemployment.
As I noted yesterday, how they think that will stop Covid, make ships go faster, get trucks delivering stuff more quickly, challenge the OPEC oil bosses and persuade Mr Putin to withdraw his forces and become peaceful is another matter.
Conclusion
So all Tuesday’s interest rate increase will achieve is damage to low-income workers and their families.
Fiscal policy changes are required to quell the massive speculative demand for housing and to increase the supply of affordable housing to low-income workers.
Monetary policy has nothing to offer at present, given the circumstances of the inflation.
The government could address the inflationary pressures by, for example, making all public transport free of charge, thus encouraging a transition away from the reliance on private cars.
If the whole world did that simple change, workers would be better off, the environment would return to the reduced emission levels we witnessed during the early days of the pandemic when the cars went off the road, AND, the greedy OPEC oil producers would be forced by the shrinking profits to reduce oil prices.
That is enough for today!
(c) Copyright 2022 William Mitchell. All Rights Reserved.
The obsession with interest rates dumbs down so much economic discourse. People spend so much time talking about all these complicated maths models, studies on micro etc., only to end up believing that one single number controls all economic activity.
Bill, you wrote, “In Australia, our tax system favours speculative investment in housing (particularly already constructed homes and apartments), which diverts *savings* away from investment in productive capital formation.”
IMO, you relapsed into neo-liberal thinking. Banks don’t lend out ‘savings’, they create money with every loan they make. Correct me if I’m wrong.
Steve_American
I’ll correct you. You’ve misunderstood the word ‘savings’. Bill is talking about ‘income’ not spent productively, being placed into speculation, which is the same as unspent income or ‘saving’. Since it isn’t spent on plant or people or development, it’s doing nothing of value apart from accruing more income for the so-called ‘investor’. All propped-up by a tax system in their favour.
OK, I stand partially corrected.
However, most buyers of existing homes do so partially with a loan. Especially when interest rates are low. Why not buy 3 homes with your cask and loans instead of 1 with all you cash? Leverage is better.
Letter in Globe and Mail.
Original submission to paper also included links to relevant sections of Billy Blog:
Re Why David Dodge Believes The Bank of Canada Must Take Quick, Aggressive Action To Reset Expectations About Inflation (Report on Business, May 2):
When bank economists talk about rapid rate hikes to break “expectations,” their idea is to slow the economy, which would create fear of unemployment and thereby stifle labour’s ability to demand pay increases in line with rising prices.
Interest rate increases are also profitable for financial institutions. Unfortunately for the rest of us, they do not resolve supply chain issues, prevent the spread of COVID-19 nor stop the war in Ukraine, all main inflation drivers.
Nor do rate hikes deal with another inflationary source: corporate price-setting that has vastly increased pandemic profit margins.
For example, the profit margin for the finance, insurance and real estate sector rose from a previous average of 14 per cent to 22 per cent in 2021.
So instead of admitting their role in this inflationary outbreak, the interest-conflicted chorus of bank economists seem to see their mission as breaking the expectations of the little guy.
Hi Bill,
Long time reader (and big fan), first time poster.
I’m not quite sure whether one of the graphs does investors justice.
The second chart – 2019 onwards – includes only the “New Construction” category, I think? If that’s the case, this covers construction loans, but excludes two other important categories – “Purchase of Newly Erected Dwellings” and “Purchase of Land”. I realise the latter isn’t important if you are using Numbers of Loans rather than Value, but, since the chart is using Value, it seems that it would be significant. The former is important because it covers investor’s preferred new dwellings – apartments. The chart then compares the “New Construction” loans to “Investor Total Ex Refinance”, which includes all the aforementioned categories, plus “Alterations, Additions and Repairs”.
Looking at the same graph, but with the missing categories added back in, and comparing to “Purchase of Existing Dwellings” instead, I think the graph would look more like this:
https://imgur.com/MNOaP0I
This gives a ratio of 1:5 of spending on new vs existing dwellings, rather than 1:11 or so.
But this might still underestimate the impact of investors. They make an outsized contribution to apartment building. The following, for example, shows the tail end of the NSW apartment construction boom (admittedly, an exceptional event). Unfortunately, pre-2019 data doesn’t provide this level of detail (or I don’t know how to extract it), so we can only see the just-pre-covid numbers. I’m switching to ratios of different new dwelling categories – “Construction” vs “Newly Erected”, and comparing investors to owner occupiers.
https://imgur.com/e5O6j9J
Investors are contributing to lower costs of housing via their preference for apartments. Note the difference to Owner Occupiers, who show a preference for “New Construction” (ie detached homes), even outside the HomeBuilder (and thus more detached housing) affected periods.
Note also that the past few years are a time when the investors’ preferred new structures – apartments – are receiving particularly bad press. This would arguably be driving a shift from new apartments to established ones for the entirety of the timeline of the chart, to an increasing degree from left to right.
It may well be that simply disincentivising investment encourages more owner occupier grade apartment construction. I have my doubts. I think any disincentives to investors need to be accompanied by policies that incentivise higher (and that includes medium) density construction for owner occupiers to preserve or improve the housing mix.
I focus on apartments because, I think, the larger cities’ housing affordability heavily depends on the structure type mix. That may not be true. Then, it’s safe to disregard the entire second part of what I’m saying. That would still leave investors contributing more to new dwelling construction than the original chart suggests.
Excellent analysis by Bill Mitchell. The negative gearing policy is a scandal: a subsidy for already well-off people so that they can acquire even more wealth and assets at the expense of the young and the poor in our society.
The other reason often claimed for raising the cash rate is to fight inflation. Simplistic conventional economics (Neoliberal Economics 101 perhaps) claims that cost-push inflation is the problem to be concerned with. By cost-push inflation they mean wage-push inflation But there are several causes of inflation (at least). Another very important cause in the modern system is profit-push inflation. This is the kind of inflation which simplistic conventional economics and neoliberal economics pretends does not exist.
If wages have been flat in Australia (and they have) what has unleashed the current inflation? Well, profits have gone up. Simplest assumption to make is that it is profit-push inflation.. There is more to the story of course and I believe that Bill has looked at multiple causes (including one-off shocks) for current inflation in Australia. This article below analyses current inflation in the US context. I think it has some interesting things to say. I think profit-push inflation could become significant in Australia if it has not already done so. Clearly, profit-push inflation will happen under situations like imperfect market conditions like monopoly, duopoly, collusion, cartel-like behaviors and perverse incentives like negative gearing which artificially inflates asset profits.
https://www.wamc.org/commentary-opinion/2022-03-18/a-profit-push-explanation-for-the-current-inflation