In the 1990s, a new industry was created in Australia. It produced nothing. But it…
US labour market continues to recover – but a long way to go yet
Last Friday (August 6, 2021), the US Bureau of Labor Statistics (BLS) released their latest labour market data – Employment Situation Summary – July 2021 – which reported a total payroll employment rise of 943,000 and a 0.5 points decline in the official unemployment rate to 5.4 per cent. The results are strong even though the US labour market is still 5,702 thousand jobs short from where it was at the end of February 2020, which helps to explain why there are no fundamental wage pressures emerging.
Overview for July 2021:
- Payroll employment increased by 943,000.
- Total labour force survey employment rose by 1,043 thousand net (0.69 per cent).
- The seasonally adjusted labour force rose by 261 thousand (0.16 per cent).
- Official unemployment fell by 782 thousand to 8,702 thousand.
- The official unemployment rate fell by 0.5 points to 5.4 per cent.
- The participation rate rose 1 point 61.7 per cent.
- The broad labour underutilisation measure (U6) fell by 0.6 points to 9.2 per cent.
For those who are confused about the difference between the payroll (establishment) data and the household survey data you should read this blog post – US labour market is in a deplorable state – where I explain the differences in detail.
Payroll employment trends
The BLS noted that:
Total nonfarm payroll employment rose by 943,000 in July, following a similar increase in June (+938,000). Nonfarm payroll employment in July is up by 16.7 million since April 2020 but is down by 5.7 million, or 3.7 percent, from its pre-pandemic level in February 2020.
In July, employment in leisure and hospitality increased by 380,000 … employment in leisure and hospitality is down by 1.7 million, or 10.3 percent, from its level in February 2020.
In July, employment rose by 221,000 in local government education and by 40,000 in private education … Since February 2020, employment is down by 205,000 in local government education and 207,000 in private education.
Employment in professional and business services rose by 60,000 in July … … [but] … is down by 556,000 since February 2020.
Transportation and warehousing added 50,000 jobs in July … the industry has recovered 92.9 percent of the jobs lost during the February-April 2020 recession (-575,000).
The other services industry added 39,000 jobs in July … … [but] … is 236,000 lower than in February 2020.
Health care added 37,000 jobs in July … [but] … is down by 502,000 since February 2020.
Employment in manufacturing increased by 27,000 in July … [but] … is 433,000 below its February 2020 level.
Employment in information increased by 24,000 over the month … [but] … is down by 172,000 since February 2020.
Employment in financial activities rose by 22,000 over the month … [but] … is down by 48,000 since February 2020.
Employment in mining increased by 7,000 in July … [but] … is 103,000 below a peak in January 2019.
Employment in retail trade changed little in July (-6,000) … [but] … is down by 270,000.
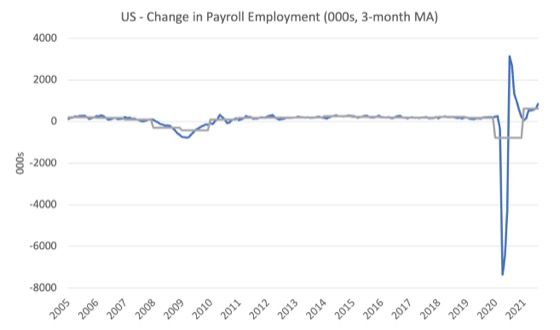
The first graph shows the monthly change in payroll employment (in thousands, expressed as a 3-month moving average to take out the monthly noise). The gray lines are the annual averages.
The data swings are still large and dwarf the past history.
The US labour market is still 5,702 thousand jobs short from where it was at the end of February 2020 and the commentary from the BLS above tells us how this shortfall is distributed across the sectors.
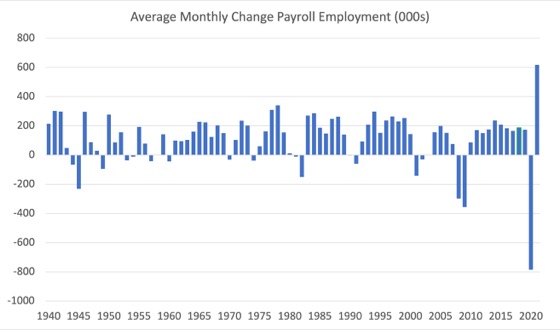
The next graph shows the same data in a different way – in this case the graph shows the average net monthly change in payroll employment (actual) for the calendar years from 2005 to 2021.
The final average for 2019 was 168 thousand.
The final average for 2020 was -785 thousand.
The average for 2021 (so far) is 617 thousand.
Labour Force Survey – employment rises strongly
The data for July 2021 reveals:
1. Employment as measured by the household survey rose by 1,043 thousand net (0.69 per cent).
2. The labour force rose by rose by 261 thousand (0.16 per cent).
3. The participation rate rose 1 point 61.7 per cent.
4. As a result (in accounting terms), total measured unemployment fell by 782 thousand to 8,702 thousand and the unemployment rate fell by 0.5 points to 5.4 per cent.
The BLS note that both unemployment measures:
The unemployment rate declined by 0.5 percentage point to 5.4 percent in July, and the number of unemployed persons fell by 782,000 to 8.7 million. These measures are down considerably from their highs at the end of the February-April 2020 recession. However, they remain well above their levels prior to the coronavirus (COVID-19) pandemic (3.5 percent and 5.7 million, respectively, in February 2020). …
The number of long-term unemployed (those jobless for 27 weeks or more) decreased by 560,000 in July to 3.4 million but is 2.3 million higher than in February 2020. These long-term unemployed accounted for 39.3 percent of the total unemployed in July.
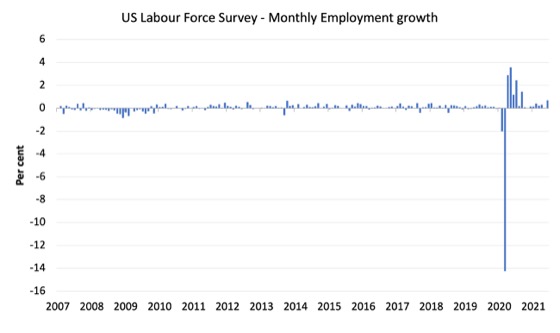
The following graph shows the monthly employment growth since January 2008, which shows the massive disruption this sickness has caused.
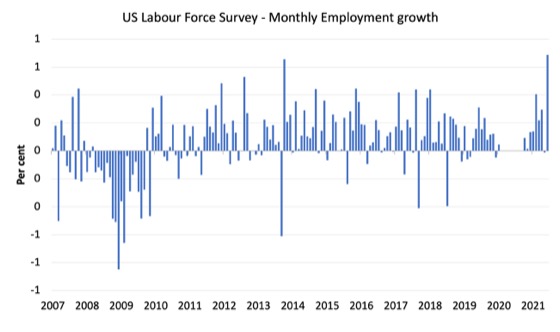
To put the recent period in perspective I took out the extreme observations (outliers) between March 2020 and October 2020 and repeated the graph.
This graph shows the current recovery more realistically.
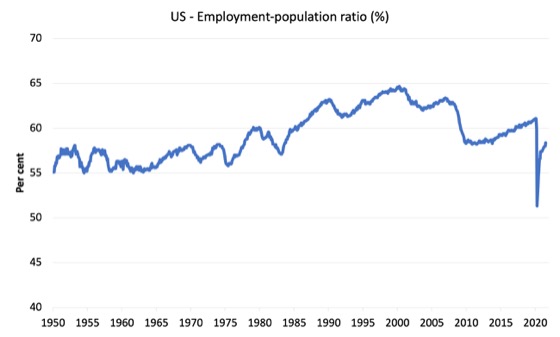
The Employment-Population ratio is a good measure of the strength of the labour market because the movements are relatively unambiguous because the denominator population is not particularly sensitive to the cycle (unlike the labour force).
The following graph shows the US Employment-Population from January 1950 to July 2021.
While the ratio fluctuates a little, the April 2020 ratio fell by 8.6 points to 51.3 per cent, which is the largest monthly fall since the sample began in January 1948.
In July 2021, the ratio rose by 0.4 points to 58.4 per cent.
It is still well down on the level in February 2020 (61.1 per cent).
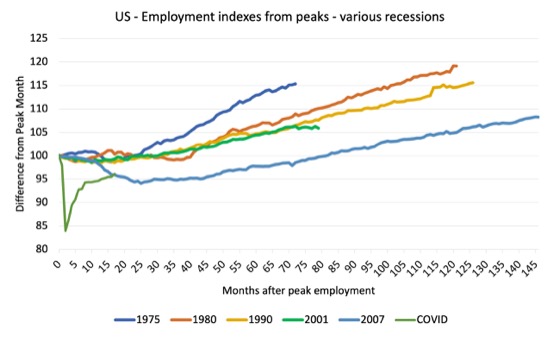
As a matter of history, the following graph shows employment indexes for the US (from US Bureau of Labor Statistics data) for the five NBER recessions since the mid-1970s and the current 2020-COVID crisis.
They are indexed at the employment peak in each case and we trace the data out for each episode until one month before the next peak.
So you get an idea of:
1. The amplitude (depth) of each cycle in employment terms.
2. The length of the cycle in months from peak-trough-peak.
The early 1980s recession was in two parts – a short downturn in 1981, which was followed by a second major downturn 12 months later in July 1982 which then endured.
Other facts:
1. Return to peak for the GFC was after 78 months.
2. The previous recessions have returned to the 100 index value after around 30 to 34 months.
3. Even at the end of the GFC cycle (146 months), total employment in the US had still only risen by 8.3 per cent (since December 2007), which is a very moderate growth path as is shown in the graph.
The COVID collapse was something else but the recent gains are evident, although the gains have been slowing relative to early in the recovery.
Unemployment and underutilisation trends
The first graph shows the official unemployment rate since January 1994.
The official unemployment rate fell by 0.5 points to 5.4 per cent in July 2021 (a significant fall).
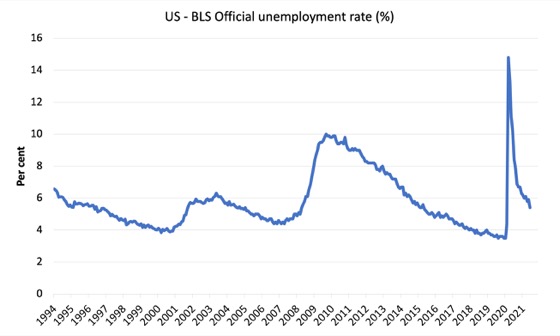
The official unemployment rate is a narrow measure of labour wastage, which means that a strict comparison with the 1960s, for example, in terms of how tight the labour market, has to take into account broader measures of labour underutilisation.
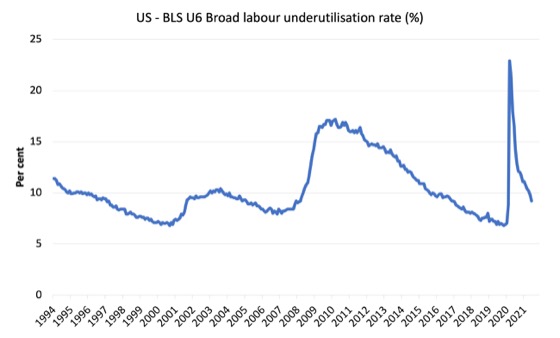
The next graph shows the BLS measure U6, which is defined as:
Total unemployed, plus all marginally attached workers plus total employed part time for economic reasons, as a percent of all civilian labor force plus all marginally attached workers.
It is thus the broadest quantitative measure of labour underutilisation that the BLS publish.
Pre-COVID, U6 was at 6.8 per cent (December 2019).
In July 2021 the U6 measure was 9.2 per cent, a decline of 0.6 points on the previous month.
Most of this fall was due to the decline in official unemployment, given that the part-time for economic reasons cohort (the US indicator of underemployment) was “about unchanged” according to the BLS.
Ethnicity and Education
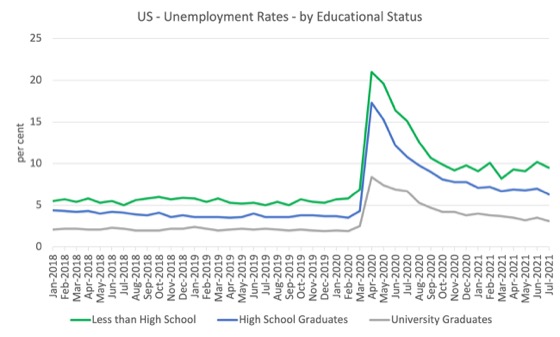
The next graph shows the evolution of unemployment rates for three cohorts based on educational attainment: (a) those with less than high school completion; (b) high school graduates; and (c) university graduates.
As usual, when there is a crisis, the least educated suffer disproportionately.
In the collapse in employment, the unemployment rates rose by:
- 14.1 points for those with less than high-school diploma.
- 13.0 points for high school, no college graduates.
- 5.9 points for those with university degrees.
The period since April 2020 has seen the unemployment rate fall by:
- 11.5 points for those with less than high-school diploma meaning the unemployment rate is now 3.8 points above the March level.
- 11 points for high school, no college graduates meaning the unemployment rate is now 4.6 points above the March level.
- 5.3 points for those with university degrees meaning the unemployment rate is now 2.3 points above the March level.
In the last month, the change in the unemployment rate has been:
- a fall of 0.7 points for those with less than high-school diploma.
- a fall of 0.7 points for high school, no college graduates.
- a fall of 0.4 points for those with university degrees.
In the US context, the trends in trends in unemployment by ethnicity are interesting.
Two questions arise:
1. How have the Black and African American and White unemployment rate fared in the post-GFC period?
2. How has the relationship between the Black and African American unemployment rate and the White unemployment rate changed since the GFC?
Summary:
1. All the series move together as economic activity cycles. The data also moves around a lot on a monthly basis.
2. The Black and African American unemployment rate was 6.8 per cent in March 2020, rose to 16.7 per cent in May and is at 8.2 per cent in July 2021. In the last month, it fell by 1 point.
3. The Hispanic or Latino unemployment rate was 6 per cent in March 2020, rose to 18.9 per cent in April and is at 6.6 per cent in July 2021. In the last month, it fell by 0.8 points.
4. The White unemployment rate was 3.9 per cent in March 2020, rose to 14.1 per cent in April and fell to 4.8 per cent in July 2021. In the last month, it fell by 0.4 points.
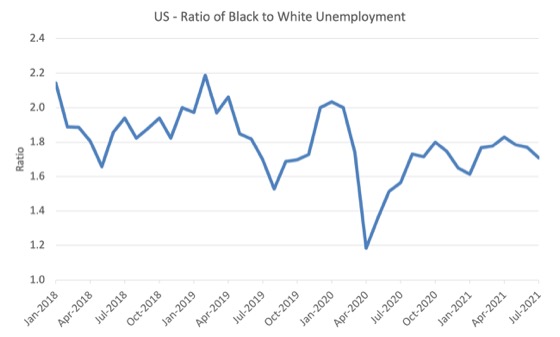
The next graph shows the Black and African American unemployment rate to White unemployment rate (ratio) from January 2018, when the White unemployment rate was at 3.5 per cent and the Black or African American rate was at 7.5 per cent.
This graph allows us to see whether the relative position of the two cohorts has changed since the crisis.
If it is rising, then the unemployment rate of the Black and African American cohort is either rising faster than the white unemployment rate or falling more slowly (or a combination of that relativity).
While there is month-to-month variability, the data shows that, in fact, through to mid-2019, the position of Black and African Americans had improved in relative terms (to Whites), although that just reflected the fact that the White unemployment was so low that employers were forced to take on other ‘less preferred’ workers if they wanted to maintain growth.
In April 2019, the ratio was 2.1 (meaning the Black and African American unemployment rate was more than 2 times the White rate).
By April 2020, the ratio had fallen to its lowest level of 1.2, reflecting the improved relative Black and African American position.
As the pandemic hit, the ratio rose and peaked at 1.8 in October 2020.
In July 2021, the ratio was 1.71 – a fall of 0.6 points from the previous month, which indicates that the relative position of the Black and African American cohort is improving.
Special Topic: Business Employment Dynamics
The BLS publish a quarterly dataset derived from the Business Employment Dynamics survey of private sector establishments.
The latest publication (published July 28, 2021) – Business Employment Dynamics Summary – for the fourth-quarter 2020 provides some interesting insights into how much change goes on in the labour market relative to the net changes reported in the labour force survey and payroll data that I analysed above.
In the December-quarter 2020, employment grew in net terms by 2,043 thousand using the establishment survey.
However, underpinning those changes, the BED data tells us a very richer story.
There were 8,756 thousand gross job gains and 6,713 thousand gross job losses.
So, a much larger amount of job creation and job destruction was going on.
Even during the March-quarter 2020, when the pandemic started to really hit, the aggregate data reported a loss of jobs of 773 thousand overall in net terms.
But driving that net figure, we know that there were 6,963 thousand gross job gained which were more than offset by the 7,736 thousand jobs lost.
The net figure reported is the difference.
The point is that even as the economy was shedding a massive number of jobs in the March-quarter, there were thousands of gross jobs created.
The following graph tracks the Gross Job Gains and Losses from the March-quarter 1995 to the December-quarter 2020 (latest).
The difference between the lines is the net rise or fall in employment, such that if the blue line is above the orange line, then employment is rising and vice versa.
The George Bush recession in the early 2000s and the GFC is notable.
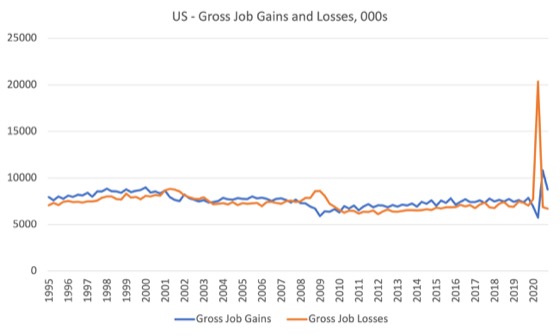
Another interesting insight is available because the data disaggregates the gross job gains into those job increases in existing firms that are expanding and new entrants who have just opened.
Similarly, the BLS disaggregate the gross job losses into those from existing firms who are contracting and firms who disappear altogether (close down).
So in the December-quarter, 81 per cent of the gross job gains came from existing firms expanding, and, 80 per cent of the gross job losses came from existing firms contracting.
Those ratios are very stable
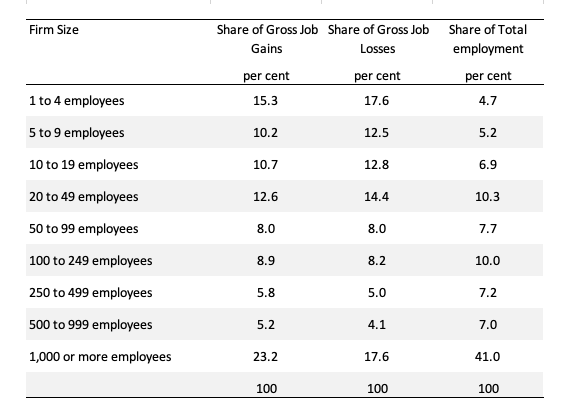
We can also examine the employment dynamics by firm size.
The following table shows the proportion of total gross job gains and losses by firms size and in the final column, the share of existing employment by each size class.
You can see there is a lot of job creation and destruction at either end of the firm size distribution but less so in the mid-range firm sizes.
I will leave the implications of that for another day.
Conclusion
The July 2021 US BLS labour market data release suggests that the labour market continues its recovery although there is still a long way to go.
The US labour market is still 5,702 thousand jobs short from where it was at the end of February 2020.
That is enough for today!
(c) Copyright 2021 William Mitchell. All Rights Reserved.
I always appreciate your analysis of the trends in employment in the U.S.
This has been the most craziest disruptive strangest year and a half in my life and I’ve been around for a while now.
I’m just wondering why you are not taking victory laps as far as MMT analysis about what the pandemic forced governments like the US to do and that it was completely possible all along without needing to worry where the ‘money’ was going to come from. Everything about it seems to have shown to me that what you have been saying is totally accurate. Is there at least a sense that people understand you were right?
Dear Jerry Brown (at 2021/08/09 at 12:34 pm)
You asked “I’m just wondering why you are not taking victory laps as far as MMT analysis”.
While some of my American MMT colleagues talk about ‘victory’, I don’t see things that way.
I am not even sure it is a competition.
But, while our work has definitely pushed the agenda significantly and exposed the failings of mainstream macroeconomics, the goal is paradigm shift.
That doesn’t occur until the senior professors in economics programs in our universities around the world are in agreement that our framework is superior.
That doesn’t occur until the mainstream teaching programs embrace our textbook (and those that will follow) and undergraduates enter the workforce upon completion with solid MMT principles to guide them in their work.
That doesn’t happen until the senior policy makers in Treasury and central banks are guided by those principles.
Given that is the hurdle (to use your sort of Olympic terminology) is still a long way off being achieved, there is no time for ‘victory’ declarations.
Rather, we just have to remain relentless and patient.
All the best
bill
Bill,
Any indication that the self employed are taking payroll jobs in these uncertain times with a possible reduction in the gig economy perhaps?
Regards
A short comment. The above is the correct way to count macroeconomic indicators, IMHO. I mean by counting real “things” and not by aggregating incommensurable things in the “dimension” of the numéraire. I am not saying Bill does the latter in any clearly invalid way. I am not familiar enough with his entire body of published work to make any such statement (now I am trying to be a bit more careful).
Of course, surveys and other methods for gathering and deriving such data of real things, as above, face enormous practical difficulties in counting “real things” at or about a point in real time “snapshot” for a nation.
By “real things” I mean mean things, objects, processes and systems which have measurable real dimensions as per the SI table (International System of Units). This might sound pedantic or doctrinaire but it is absolutely necessary for any endeavor seeking an aspect of empirical and scientific rigor even if other aspects of the discipline belong in the realm of moral philosophy.
Counting quantities of real things which are closely comparable in category terms is valid. This is as per the base unit “mole” in the SI which counts quantities of “elementary entities”. Reasoning in this way, counting humans, counting dental caries in humans and counting humans in jobs (given a real, defensible and operable definition for “a job”) are all valid enough procedures.
But counting stuff in the numéraire leads to all kinds of fallacies in orthodox or at least in bowdlerized orthodox economics. Just my ontological two bob’s worth and all IMHO of course.
“Rather, we just have to remain relentless and patient”.
If man-made climate change is a real emergency, which more and more people seem to be asserting these days; and if the climate related economic catastrophes become more frequent and more expensive, the BIS might indeed have to ‘print’ the required c. $100 trillion to close down and compenstae the fossil industry, while funding the necessary resource mobilization to transition to green ASAP, even if restricted to utilizing current ‘primitive’ renewables-storage technologies like pumped hydro. {According to the ANU there are sufficent suitable pumped-hydro sites around the globe which could store energy from solar panels covering the world’s deserts); like i said, primitive but doable, to eliinate CO2 emissions *within a decade*. Private enterprise and free markets of course would of necessity be relegated to a very minor (inventive) role, in such a scenario.
But of course in rea,lity we will be forced to witness the US claiming that “China is not doimg enough” in the upcoming talk-fest in Glasgow… hypocrttes all of them…as if any nation can achieve anything by acting alone, in this apparently real global emergency.
Excellent, but shouldn’t there be graphs showing how bad things are for youth, much the way you did for blacks ?
Keep up the great work Bill!
Thanks Bill. You know you have convinced me at least. Maybe when we get the Job Guarantee implemented you can have a victory lap. Better yet- a parade! It isn’t easy, but your work has been showing us the way.
If I may make a slightly discursive and possibly self-indulgent long comment. Biography is political economy. The combined thought processes and life trajectories of all people on earth make our global political economy. Natural forces, especially in the form of global limits and catastrophic disjunctures also play a central and clearly limiting role. Natural forces and resources clearly provide and enable in the first instance but ultimately they also place limits on the real economy.
I read “The Limits to Growth” within a few years of publication. It was published in 1972. I think I read it in about ’75 or ’76. I was a Humanities student doing an “arty-farty” B.A, for a lark and for the TEAS [1] but I also had some passes in semester 1 tertiary science subjects (Physics, Biology, Chemistry and Cellular Biology). I had friends in the Environmental Studies course. One of them loaned me “The Limits to Growth”. I read it in less than a day – it’s not a large book – and I said to myself, “Oh shite, that’s it. We are done for. Nobody will change. Business as usual and attempted endless exponential growth will continue.” It turns out my initial combined scientific and gut assessment was correct. Here we are at “the end of all things” as Frodo said to Sam. And there’s no discernible “eucatastrophe” [2] miracle around the corner.
I am incredibly disappointed in humanity and incredibly angry at it. This judgement applies to myself also. After all, I too am all too human. It was very difficult to swim against the current, especially once one got enmeshed in marriage, mortgages, cars and kids. In a consumer capitalist system, one’s carbon footprint grew like Topsy.
I endeavored to do what I could. I bicycled to the station and took the train to work. My wife and I took less traveling holidays and drove less miles or kilometers than anyone we knew (in middle class suburbia). We frequently bought second hard and recycled stuff. We kept stuff years longer than most people do and wore it out before replacement. My motives were mostly ecological although I can be stingy too. My wife was and is just naturally a frugal person with a great desire to channel most of our resources to educate and provide well for our kids: but with worthwhile experiences and things, not merely packaged consumerist experiences and plastic junk. But one always is aware that all one did was still not enough.
My final modest career or rather job (after several earlier laborer and machinery operator jobs), was curtailed by my own dissent with bosses and the system. This dissent was mostly about the many mistakes I felt our (neoliberal) governments and my department were making in the delivery of welfare. I pretty much know my file was, metaphorically speaking, stamped “never to promoted” and I was then pushed into early retirement. I didn’t have to be pushed hard. By that time I hated the system, was a very angry late middle age man, and realized I didn’t recognize or like the angry person I had become.
I also found I could not talk to any of my (mostly very intelligent) extended family or friends about environmental issues, sustainability, limits to growth and related matters such as political economy. I felt astonished at how anti-intellectual these intelligent, professional people had become, siloed in their specialties, their metiers, and unable to think in the humanities, generalist, or even complex interrelated systems paradigms. If I was not to be ostracized socially, I had to desist from raising any serious and intense concerns about where the political, economic and earth systems were headed.
This did convince me that people need a generalist science-humanities education (as I obtained for myself by being an educational institution and autodidact gadfly) before specializing in a narrow discipline. Lamentably, the great scientific humanist polymaths seem to be very much a thing of the past. I am not great but I am a polymath and autodidact, except ironically not in advanced mathematics training.
This autobiographical sketch is, I think, illustrative of how the whole system functioned at every level to narrow minds, narrow imaginations, narrow the communal SIS [3,] suppress dissent, suppress different ideas, suppress imagination and suppress creativity except in the service of mass entertainment and the propaganda commonly called “advertising”. Capitalism is a totalising system which requires and forces a person to think in one way only. This system has forced all or most of us along its “metal rails”, or rather along the normatively pro-ordained algorithmically prescribed path of capitalism, to where we are today. Capitalism is a normative system in an unconscious search for a real asymptote limit. It’s about to find it.
It is hard for people to imagine catastrophes, especially one undoing their own beloved modern civilization, “immortal” capitalism, yet catastrophes are very much part of the geological and historical record. There are entropic reasons for this. Building anything complex, evolutionarily or socioeconomically, takes great time and carefully applied energies. Destroying it takes little time and only sometimes vast amounts of brute natural forces or energies. The total weight of COVID-19 virions on earth (and mostly in people at any given time) were estimated at 0.1 kg to 10 kg at a recent time point of the pandemic; obviously a fairly wide margin of error. If we assume a middle estimate of 1 kg, we must marvel at the power of this natural “bio-hacker” with its tiny packet of elegant, succinct and evolutionarily self-optimizing code. It has brought neoliberalism or late stage capitalism to its knees. I argue this despite the “green shoots” of the US recovery, for example.
Fiscal stimulus certainly works and asset inflation is probably much more a product of the quantitative easing that gives cost free (real-interest free) money to the oligarchs and corporations. The COVID-19 pandemic forced an almost instant about-face of fiscal policy with, as we see now, vast amounts of fiscal stimulus, much still being channeled to the oligarchs and corporations. However, real limits matter too, finally and ultimately. Without a sustainable footprint and a circular economy in real resource and energy flow terms at least, we are all dead and in relatively short order in historical terms. It’s as simple as that.
Out of control existential terror and nihilism are not useful qualities for the practical or theoretically focused man or woman. However, a negative frisson, if I can term it that, needs to be felt, I argue, to jolt people out of their craft and technical silos, out of their practiced metiers and out of their everyday habits, concerns and enjoyments (if any remain in lock-down) in order to see the bigger picture. If a frisson of terror doesn’t work, it’s going to take real terror and that is not long coming unless we radically change our political economy and production / consumption systems and our gestrategic competition systems. We need to “panic promptly” but act advisedly and radically.
Sadly, we really can’t get this message through to the masses currently, sunk as they are in the false consciousness of consumer capitalism. Nor can we get any message though to our arrogant, exploitative, cruel, selfish and hubristic elites, elevated and intoxicated as they are in their self-awarded, self-indulgent, biosphere destroying Fin de siècle luxuries, extravagnzas and spectacle.
All that can be done in my opinion is to do the necessary theoretical groundwork for a radically new system. I call it preparing theory for the time when it is needed. MMT may well be a station on that journey but I would also hope eventually for a socialist system which manages to evolve or emergently progress beyond the need for money at all. This seems unimaginable now just as capitalism would have seemed unimaginable to a medieval peasant, burgher or “noble”man. You may say I’m a dreamer. 😉
1. TEAS was the Tertiary Education Assistance Scheme, abolished of course by the neoliberal scum.
2. Eucatastrophe is a J.R.R. Tolkien neologism meaning the opposite of a catastrophe. It is a sudden, vast, positive event which saves a seemingly hopeless position; the hopeless position and the saving event often both being vast and momentous. The way I see it, only people who believe in miracles believe in the possibility of eucatastrophes.
3. SIS – A SIS is a “Socially Imaginary Signification”. I prefer to think of it as socially imaginable concepts in general or socially imaginable concepts of socioeconomic possibilities. People now, in the main, in the West cannot imagine anything other than consumerist capitalism. It is for them the only existence imaginable and they lack the concepts, the broad reading and the historical knowledge to imagine anything else. It is a lamentable one dimensional mental existence to use a Marcusian metaphor.
@Ikonoclast, excellent, timely comments.
Economists are still enraptured by ‘GDP’ and ‘consumption’; we should be minimizing both on behalf of poverty eradication, education, and promotion of healthy bodies/minds to enable enjoyment of the wondrous ubiverse by all living souls.
Oeople, I found a great youtube video.
To find it google “Bill Rees to the Canadian Club of Rome”.
It is great because it explains why people are stuck on the road to ACC of 4 deg. C, why that is bad, how neo-liberal econ. is a problem, and especially that ACC is just a symptom of our real problem, that we have 4 times too many people consuming 8 times too much stuff. He calls the real problem ‘ecological overshoot’.
.
Yeah Steve- the thing is, I am never going to read something that you say claims our real problem is there are 4 times too many people in the world. If you believe that I will let you pick the 75% of the population that has to go. Just as long as you go first to lead by example. I doubt anyone will follow your example though.
Oops,
People, …
He talks for 40 min. Then the Q & A is 1 hour.
@ Jerry Brown,
Exactly.
I would be the 1st, if I though it would be enough to convince all humans.
I can say that because I’m almost 75 yo. I would die to save humnity.
Just like Native American grandparents did stay behind and die so the tribe could live on.
If Rees is right there likely is no morally acceptable way to save humanity.
Like I’ve said, I read The Limits to Growth” in 1972 or 3. If humanity had taken steps then, a morally acceptable way was present.
I even created a world wide system of baby licenses to limiy each person to one child. If their 1 died young, they got their license back to have another. They could also sell it for cash, so the rich could have more kids. This was my idea of the most moral way to limit population growth.
Ok Steve. But don’t off yourself until that gets through a peer review at the very least. Actually, just wait for FDA approval of it- that will give you ten years probably.
I can’t talk about this anymore. This is worse than talking about the Nazis and that is off limits.
I guess I’m an optimist Bill. I don’t think that is a bad thing- generally I might be happier but risk being disappointed more often. At least, so I think. But your co-author L. Randall Wray wrote a fairly optimistic report on the situation in the U.S. regarding MMT. So I’m not the only one out there.
I think it is an excellent piece of work for many different reasons.
http://www.levyinstitute.org/pubs/e_pamphlet_2.pdf