Last Tuesday (May 12, 2026), the Australian Treasurer introduced the 2026-27 Fiscal Statement (aka Federal…
Australia – Treasurer’s fiscal statement 2020-21 – abandons nation building
Here is some analysis of Tuesday’s Fiscal Statement from the Australian Treasurer. It was touted as the most important fiscal statement in 100 years (or something like that). What we got was a supply-side statement about markets creating jobs, massive tax cuts for high income earners and virtually nothing for the lowest paid. There was very little about the climate crisis. There was a lot of talk about jobs, jobs, jobs but no direct job creation. And the Government’s own estimates suggest that unemployment will remain at elevated levels through 2023 which means that the scale of the fiscal intervention is grossly inadequate. I see very little good in this fiscal strategy and a lot of bad. There are many commentaries available in the mainstream media which cover specifics and so I am just concentrating on things that I find important.
Background to Australia’s 2020-21 fiscal statement
The Australian economy went into the pandemic clearly struggling with domestic demand faltering and overall growth well below trend and only being held up by a strong term of trade.
Growth in GDP per capita was negative in the last two quarters of 2018 and sluggish leading into the pandemic.
The broad labour underutilisation rate (unemployment plus underemployment) stood at 14 per cent in March 2020 and the pandemic pushed it up to 20.1 per cent in April.
Growth in the wage price index has been at record lows and despite low inflation, real wages has been flat or negative in recent years.
The policy environment dominated by the attempts by the Federal government to record its token fiscal surplus was directly responsible for the slowdown in economic activity.
For too long, governments have relied on the increasing private debt to fund household consumption expenditure in an environment of flat real wages growth, which while growth ensued, gave them cover to continue to withdraw net public spending.
This was the same strategy that Howard and Costello pursued after 1986, and household debt went from 85.8 per cent of disposable income in early 1996 to 184.1 per cent by the end of 2007.
The household saving ratio also fell dramatically and was regularly negative after 1999 until the GFC.
However, the decline in the economy’s performance can be traced back earlier to the 1980s, when successive governments effectively abandoned a commitment to full employment, engaged in significant microeconomic policy shifts, and prioritised monetary policy over discretionary fiscal policy, as the principle counter-stabilisation policy tool.
After that point, unemployment ceased to be a policy target and, instead became a policy tool to keep inflation low.
Government shifted from a commitment to full employment (demand-side goal) to the diminished supply-side goal of full employability.
Reduced growth in output and productivity followed with persistent elevated levels labour underutilisation
The following table captures a decade summary to illustrate where the Australian economy has been and is now.
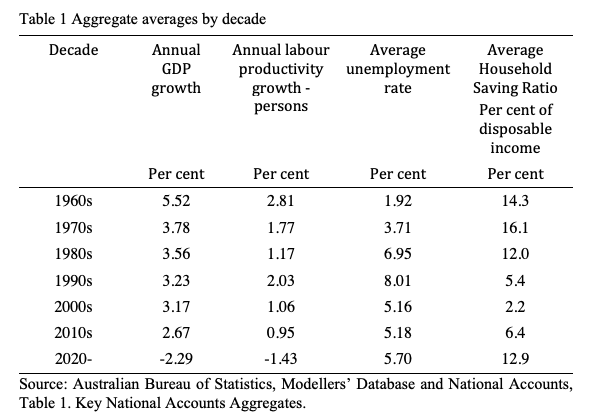
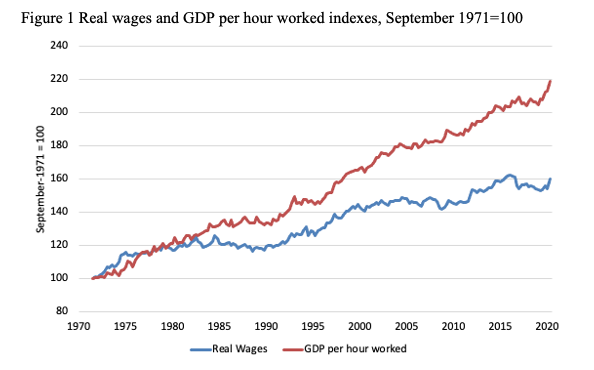
Another characteristic of the period since 1980 has been the growing productivity-real wages gap and the decline in the wages share in national income.
Real pay used to grow in line with productivity growth, which allowed for broad increases in material living standards and consumption growth without high levels of indebtedness.
When the Hawke government came to power, the wage share (in factor income) was 60.1 per cent.
While there have been several factors involved, government legislation and changes to wage setting arrangements have suppressed the capacity of workers to enjoy real wages growth.
Persistent elevated labour underutilisation has exacerbated the situation.
As a result, there has been a systematic decline in the wage share. In March 2020 it was 52.5 per cent and fell below 50 per cent in the June quarter.
The following graph shows this sorry history.
This introduction provides us with the background to the Treasurer’s 2020-21 fiscal statement.
The most recent data shows that:
1. Australia’s GDP growth rate was minus 7 per cent in the June-quarter 2020 and falling fast – see Australian economy collapses and the federal government goes missing (September 2, 2020).
However, before the pandemic, the growth rate was well below trend (of around 3.2 per cent).
Household consumption growth was already declining because of flat wages growth and record debt levels. In the June-quarter, private consumption collapsed and took 6.7 points off the growth rate (almost all of the decline).
Business investment growth has been largely negative for some quarters now and since the March-quarter 2018 has made on one positive quarterly contribution to growth. The longer-term damage of this complete stalling in capital formation will be significant.
2. Australia’s labour market was already weak with employment growth regularly around zero, a bias towards casualisation, and the pre-pandemic underutilisation rate stuck around 13.5 per cent and rising in May 2020 to 20.2 per cent.
See Latest employment data in Australia continues sorry tale and what I would do about it (September 24, 2020).
3. We now have 2,428.6 thousand workers who are either unemployed (921.8 thousand) or underemployed (1,506.8 thousand).
4. Australia’s participation rate is below the pre-GFC levels as is the Employment-to-Population ratio. Since March 2020, 207.6 thousand workers have also left the official labour force, which adds an additional 1.4 points to the official unemployment rate, given those workers would take a job if offered.
5. Since February 2008 (the low-point before the GFC), teenagers have lost 136.4 thousand almost all of them full-time jobs (net). Since November 2019, they have lost 64.2 thousand (net) jobs.
6. Wages growth is at record low levels and real wages growth has been flat to negative over the last several years, while corporate profits have boomed – see Wages growth in Australia at record lows (August 17, 2020).
7. As noted above, the wage share is now below 50 per cent.
8. Australian households are carrying record levels of debt, while real estate prices are falling.
The most recent RBA – Financial Stability Review – April 2020 – reported that:
… the level of household debt and elevated housing prices are longstanding risks for the Australian financial system. In the period ahead, many households will find their finances under strain due to efforts to contain the virus … many highly indebted households have only small buffers and so are more vulnerable to lost income.
9. The unemployment benefit payment has not adjusted in line with poverty line estimates for some years and recipients have been forced by both sides of politics to live well below the accepted poverty line.
See – ‘Progressive’ groups in Australia captured by neoliberal ideology (September 18, 2018).
During the pandemic, the government has temporarily increased the JobSeeker payments but have already cut the supplement in half from September 26, 2020 and will terminate it altogether in January 2021.
10. Inflation is persistently below the Reserve Bank’s lower targetting bound and shows no signs of increasing – it recorded a negative outcome (-0.3 per cent) in the June-quarter 2020.
11. The most recent data released by the Federal government in its – Budget Paper No. 1 – shows the projected fiscal balance has shifted from a deficit of:
(a) $A690 million (0.0 per cent of GDP) in 2018-19 – and nearly got to the vaunted (obsessive) surplus before the pandemic struck. This marked a massive fiscal contraction where the deficit fell from 3 per cent of GDP in 2013-14 to 0 per cent by 2018-19 as private spending remained weakened.
(b) $A85,272 million (4.3 per cent of GDP) in 2019-20 – reflecting the first stimulus associated the pandemic.
(c) $A213,654 million projected (11.0 per cent of GDP) in 2020-21.
Look back over the 13 background facts and ask yourself which is the outlier.
Facts 1-10 are all directly related to Fact 11, which is what I want to talk about next.
The Government’s Economic Outlook
The Government is projecting:
1. Real wage cuts in 2020-21 (0.5 points) and no growth in real wages in 2021-22.
2. Unemployment at 6.5 per cent in 2021-22.
3. Real GDP growth at 3.25 per cent in 2021-22.
4. “Population growth is assumed to be around 1.2 per cent in 2019-20, 0.2 per cent in 2020-21 and 0.4 per cent in 2021-22.”
I checked the ABS Demographic projections and found that the growth in the total population projections are almost identical to the projected growth in the Working Age Population over the fiscal forecast period, so we will assume that the WAP will grow about the same rate as projected for total population growth by the government.
Thinking about that I delved into the ‘Economic Outlook’ (Table 1 of Statement 2 on Budget Paper No. 1) to see if it all added up.
It doesn’t appear to.
There appears to be internal inconsistencies in the Treasury forecasts, which is a regular occurrence. Remember their $A70 billion error in the JobKeeper estimates in March 2020.
The following table takes actual data for 2018-19 and 2019-20 (we already know these facts) and then extrapolates the major aggregates based on the Treasury’s forecasts that appear in the ‘Economic Outlook’.
Specifically, I grew the Working Age Population by 0.2 and 0.4 per cent in 2020-21 and 2021-22, respectively.
I grew employment (EMP) by the forecasts by 2.75 per cent and 1.75 per cent in 2020-21 and 2021-22, respectively.
Using the Treasury’s Participation rate forecasts (LFPR) I then estimated the Labour Force (LF) for 2020-21 and 2020-22, based on the projected WAP.
The difference between the projected Labour Force and the projected employment then gives is an estimate of unemployment and the unemployment rate for 2020-21 and 2020-22.
So using this method (that is, building the dataset based on Treasury estimates and proper accounting entities) we would find an unemployment rate of 3.1 per cent in 2020-21 and 2.1 per cent in 2021-22.
But, and here is the inconsistency, the Treasury’s Economic Outlook assumes the unemployment rate will be 7.25 per cent in 2020-21 and 6.5 per cent in 2021-22, a very large discrepancy.
The extrapolated unemployment rates in the Table will not happen under current policy and circumstances.
So something is very wrong and I have no way of telling what.
Of the Treasury estimates, I trust their unemployment rate projections more than I do their employment growth estimates.
| Fiscal Year | WAP (000s) | LFPR (%) | LF (000s) | EMP (000s) | UN (000s) | UR (%) |
| 2018-19 | 20415.7 | 65.7 | 13,412.0 | 12,725.5 | 686.6 | 5.1 |
| 2019-20 | 20,725 | 65.4 | 13,544.2 | 12,782.3 | 761.9 | 5.6 |
| Extrapolated estimates based on government projections follow | ||||||
| 2020-21 | 20,766.4 (a) | 65.25 (a) | 13,550.1 (b) | 13,133.8 (b) | 416.3 (b) | 3.1 (b) |
| 2021-22 | 20,849.5 (a) | 65.5 (a) | 13,656.4 (b) | 13,363.7 (b) | 292.7 (b) | 2.1 (b) |
(a) Represents the Government forecast.
(b) Represents the logical extrapolation based on (a).
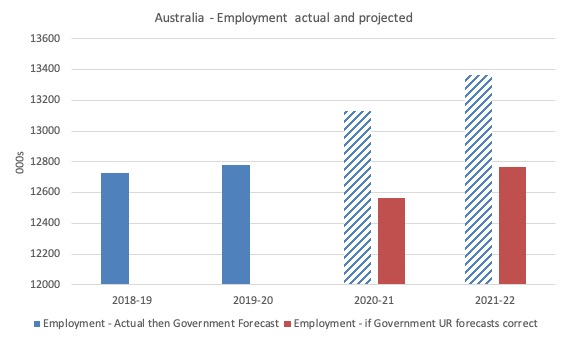
The following graph shows us what would be the case if the employment growth forecasts in the fiscal statement are correct – blue columns (filled = actual, patterned = government projection) versus the employment growth that would satisfy the aggregates if the government’s unemployment rate projections are correct (red columns).
The blue column scenario is highly unlikely if not impossible under the current policy settings.
So, under the more likely assumption that their unemployment rate projections are more likely to be closer to fact then you can see that their policy stance would deliver no effective growth in employment over th eperiod 2019-20 (last year) and 2021-22 – two years hence.
That would mean that official unemployment which currently is at 921.8 thousand would only drop to 887.7 thousand two years hence and would remain higher over the next year.
That should condition the way you assess the overall fiscal stance outlined by the Government last Tuesday.
While they told everybody it is about jobs, jobs, jobs, a deeper analysis of their projections would suggest quite the opposite.
And, if unemployment is really projected to hover around 900 thousand for the next two year, you can be certain that underemployment will hardly move also.
Conclusion:
So the fiscal strategy of this Government is deliberately forcing up to around 18 to 20 per cent of the willing and available workforce to remain idle in one way or another for the next two years.
How can anyone support that?
The proposed tax cuts are outrageous
I discussed the reasons why I do not support tax cuts at present in this recent blog post – Tax cuts are unlikely to work at present and are less effective than government spending increases (October 1, 2020).
But here is some more information now that we know what the Government’s intentions are.
According to the ABS Household Income and Wealth, Australia (Latest release for 2017-18), the following annual equivalised disposable household income by quintile applies:
1. Lowest quintile: $A23,400
2. Second quintile: $A51,200
3. Third quintile: $A85,350
4. Fourth quintile: $A130,700
5. Highest quintile: $A270,150
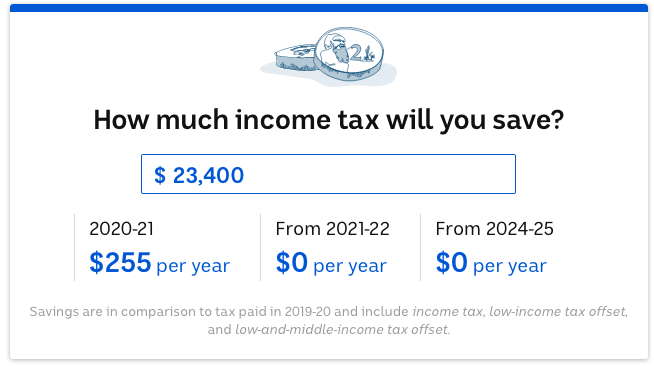
Here are three graphics that tell you all you need to know about the tax cuts that the government has enacted (Source).
The first shows the increases in disposable income for a person earning $A23,400 per annum, over the estimates horizon – so someone near the top of the second quintile (and I am just assuming that all the income is derived from labour sources, which is incorrect but doesn’t alter the relativities).
The second shows the increases in disposable income for a person earning $A50,000 per annum, over the estimates horizon – so someone near the top of the second quintile.
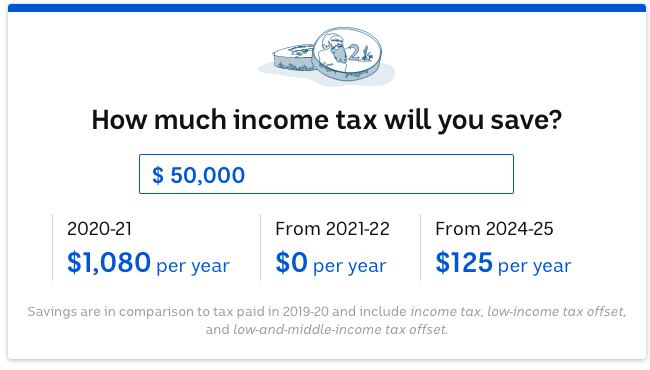
The third shows someone in increases in disposable income for a person earning $A300,000 per annum – which would be in the range currently applicable to the highest quintile given the ABS estimates were from 2017-18.
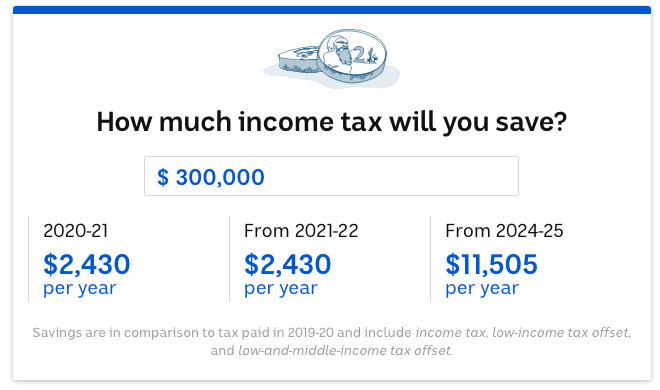
Quite some difference. It doesn’t pay to be a low-paid worker in Australia given the way this Government thinks.
These are highly regressive tax cuts and will do little to stimulate aggregate spending.
The tax cut will deliver massive benefits to the high income cohorts and the lower income workers will get very little or no relief at all.
The fiscal system becomes much more regressive as a result of this flattening. And there are no fiscal measures likely to offset that increased tax regression on the spending side.
The Government is also claiming that these tax cuts will drive growth.
Remember ‘trickle down’ economics.
These tax cuts are unlikely to increase labour supply (one of the tenets of supply-side trickle down) and, as well, they are unlikely to boost overall spending much, given the big winners have much lower marginal consumption spending propensities
Further, the claim that it is better to get the tax cuts than a wage increase are flawed even in basic arithmetic.
A given percentage tax cut delivers much lower income boost to workers than a similar increase in wages.
These tax cuts will not redress the damage that the flat wages growth is bringing.
If the Labor Party vote to allow these tax cuts to go through then they will be completely abandoning their so-called mission.
The contractionary bias
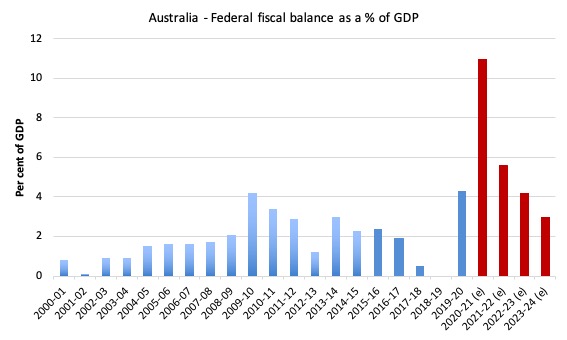
The fiscal statement released last night by the Treasurer has the following forward estimates for the fiscal balance as a percentage of GDP. The graph starts in 2000-01 and goes to 2023-24
The red bars are the latest projections from the current Government as outlined in Tuesday’s statement.
So in the fiscal year just ended (2019-20), the Government estimates it will have a deficit of 4.3 per cent of GDP. A net fiscal shift of the same amount given it was at zero last year.
Then for current fiscal year (2020-21), the government is proposing a fiscal deficit of 11.0 per cent of GDP, a shift of 6.7 per cent.
For the next two years, the government is contracting in the hope that the non-government sector will pick up the slack.
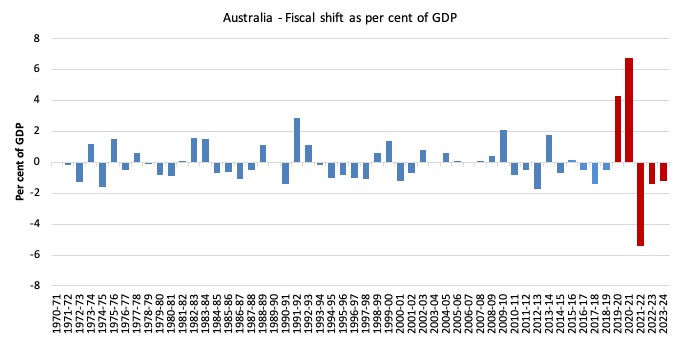
The fiscal shift from one year to another is the change in the fiscal balance as a percentage of GDP changes. It is the result of two factors – the fiscal balance itself (in $As) and the value of nominal GDP (in $As).
The following graph shows the recent history (from 1970-71) of fiscal shifts up to the end of the projection period (2022-23).
The biggest fiscal swing in the previous conservative government’s tenure was in the financial year 1999-2000 (a shift of 1.4 per cent).
A sharp slowdown in the economy followed that contraction and the fiscal balance was in deficit two years later (2001-02).
The Australian economy only returned to growth because the Communist Chinese government ran large fiscal deficits themselves as part of their urban and regional development strategy. That spurred demand in our mining sector.
The largest fiscal shift in the sample period shown was the second-last fiscal statement from the previous Labor government in 2012-13 which was equivalent to 1.8 per cent of GDP. They prematurely withdrew the fiscal stimulus bowing to the assault from the neo-liberal press and commentariat about the dangers of deficits. It was a moronic and damaging retreat.
A major slowdown followed and dented the recovery from the GFC that had been spawned by the fiscal stimulus in the previous two years.
That Labor government was obsessively trying to achieve a fiscal surplus in 2013-14 and was blind to the reality that the private domestic sector was not going to fill the spending gap left by the retrenchment in net government spending.
The result – which was totally predictable – the economy took a nosedive, tax revenue fell even further and the fiscal balance moved further into deficit with unemployment rising.
The current conservative government was elected in September 2013 (and has been subsequently reelected twice since).
In Tuesday’s fiscal statement, the forward estimates show that by 2021-22 (while unemployment is still around 6.5 per cent (according to the Government’s own projections), there will be a massive tightening of fiscal policy (red bars).
And the stimulus that is being introduced before that is wholly insufficient to reverse the damage from the pandemic lockdowns.
So it is a fail on both sides of the fiscal cycle – stimulus and contraction.
Taking the basic facts I listed at the outset as a whole, the obvious conclusion is that there needs to be a much larger fiscal deficit in the next two years – up to 20 per cent of GDP and the tapering should be only planned once the unemployment rate has fallen well below 3 per cent.
The improvement in the private sector’s debt position will be sabotaged by government
The economic predictions, which underpin the fiscal statement and are contained in Budget Paper No.1, can be expressed in terms of the sectoral balances to examine implications for shifts in private sector debt positions.
We know that the financial balance between spending and income for the private domestic sector (S – I) equals the sum of the government financial balance (G – T) plus the current account balance (CAB).
The sectoral balances equation is:
(1) (S – I) = (G – T) + CAB
which is interpreted as meaning that government sector deficits (G – T > 0) and current account surpluses (CAD > 0) generate national income and net financial assets for the private domestic sector to net save overall (S – I > 0).
Conversely, government surpluses (G – T < 0) and current account deficits (CAD < 0) reduce national income and undermine the capacity of the private domestic sector to accumulate financial assets.
Expression (1) can also be written as:
(2) [(S – I) – CAB] = (G – T)
where the term on the left-hand side [(S – I) – CAB] is the non-government sector financial balance and is of equal and opposite sign to the government financial balance.
This is the familiar MMT statement that a government sector deficit (surplus) is equal dollar-for-dollar to the non-government sector surplus (deficit).
The sectoral balances equation says that total private savings (S) minus private investment (I) has to equal the public deficit (spending, G minus taxes, T) plus net exports (exports (X) minus imports (M)) plus net income transfers.
All these relationships (equations) hold as a matter of accounting.
The following graph shows the sectoral balance aggregates in Australia for the fiscal years 2000-01 to 2024-24, with the forward years using the Treasury projections published in ‘Budget Paper No.1’.
The vertical black line demarcates the actual from the projected data. I have assumed that the external position in 2021-22 and 2023-24 will be the same as the Government’s estimate for 2021-22, although if growth in imports return to their more typical levels (they are way down at present) the situation for the private domestic sector would be worse than shown here..
All the aggregates are expressed in terms of the balance as a percent of GDP.
I have modelled the fiscal deficit as a positive number because it amounts to a positive injection to the economy. You also get to see the relationship between it and the private balance more clearly.
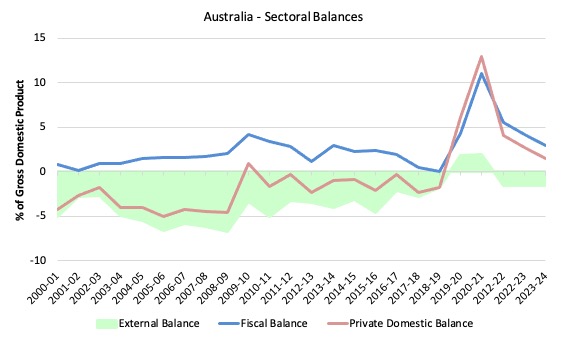
So it becomes clear, that with the current account deficit (green area) projected to record a slight surplus in 2020-21 then return to a small deficit over the remaining years, the private domestic balance overall (solid red line) becomes the mirror image of the projected government balance (blue line).
In the earlier period, prior to the GFC, the credit binge in the private domestic sector was the only reason the government was able to record fiscal surpluses and still enjoy real GDP growth.
But the household sector, in particular, accumulated record levels of (unsustainable) debt (that household saving ratio went negative in this period even though historically it has been somewhere between 10 and 15 per cent of disposable income).
The fiscal stimulus in 2008-09 saw the fiscal balance go back to where it should be – in deficit. This not only supported growth but also allowed the private domestic sector to start the process of rebalancing its precarious debt position.
That process has been interrupted by the renewal of the fiscal surplus obsession since 2012-13.
You can see the red line moves into surplus or close to it. The long-run average private domestic deficit is 1.3 per cent of GDP and was achieved largely when the household saving ratio was between 10 and 16 per cent and private investment in capital formation was strong.
That was a sustainable position because the capital investment was boosting GDP growth and providing returns to keep the debt in check.
The fiscal strategy outlined by the Government on Tuesday will allow the private domestic sector to increase its saving (and pay down debt) but as the government withdraws its stimulus, the private domestic sector will head back towards deficit and resume accumulating debt.
My wish list and the reality
With a 7 per cent decline in GDP in the June-quarter 2020 and more than 10 per cent of workers unemployed (including hidden) and that many workers again underemployed, Australia needed a massive fiscal injection targetting demand and job creation.
The fiscal statement issued on Tuesday gave us a modest injection (relative to what was needed) and no direct job creation proposed.
Further, the health crisis maybe occupying all our attention at present but the climate crisis hasn’t gone away and requires urgent policy attention.
The Government’s response to the climate crisis is essential to say they are doing great (channelling Trump language) when, in fact, they are acting like vandals and selling the nation out to carbon-intensive industries, such as coal.
Redressing the impacts of the past austerity (inflicted by both the Labor and conservative governments) also required a substantial shift in fiscal policy.
I formulated this wish list a few weeks ago. Here is what the government thought of it as implied by its own fiscal strategy:
1. Fast track the shift to a non-carbon economy – virtually nothing in Tuesday’s statement.
2. Fast track the design and contracts for a fast train from Brisbane to Melbourne – virtually nothing in Tuesday’s statement.
3. Reassert NBN Co as a public company and abandon its ‘cost recovery’ constraints and offer free services to retailers at fast speeds and regulate low retail charges – – virtually nothing in Tuesday’s statement. The Government just said it would allow the NBN Co to borrow more to improve regional infrastructure.
4. Abandon JobKeeper and instead directly pay wages and salaries of all workers in line with their previous tax statements – virtually nothing in Tuesday’s statement other than to reassert the planned cuts.
5. Fund TAFE properly to increase its capacity to train apprentices and fund the creation of thousands of apprenticeships across Australia – As the Australian Education Union concluded – “The Morrison government’s budget has failed to provide a single dollar of specific funding for TAFE – in fact it is completely silent on TAFE altogether” (Source).
6. Invest in manufacturing capacity to make Australia more self-reliant in a number of areas – minimal investment proposed in Tuesday’s statement.
7. Increase the funding to universities and regulate the salaries of the managerial class in that sector downwards as a condition for adequate funding of research and teaching. End the trend towards casualisation in the research sector – Some additional support for research but widespread job losses will still occur given the loss of overseas income and no support under JobKeeper.
8. Regulate the GIG economy to bring it in line with other labour market segments – Nothing.
9. Require the Fair Work Commission to restore penalty rates to all workers who have lost them – Nothing.
10. Introduce a Job Guarantee – Light years away.
11. Introduce a state-owned bank that can provide competition to the big 4 and bring down charges, gouging etc – Nothing.
12. Free child care – Nothing.
13. Free public transport – Nothing.
14. Enhance the career public sector in several areas – Nothing.
15. Ensure the CSIRO, the ABC, SBS are adequately funded as public institutions – Nothing.
16. Increase foreign aid substantially – CUT.
17. Abandon the Closing the Gap process, and restart it with proper targets that are properly funded – which will include many of the initiatives outlined above – Nothing.
18. Stop defunding public education and revise the schooling funding model in favour of public schools – Nothing.
19. Invest in 400,000 or more social houses to meet the massive excess demand and make housing affordable for low-paid workers and their families. This will be a big boost to the construction sector – Nothing. Zero mention by the Treasurer (Source):
20. Retrofit the existing housing stock to make it more carbon neutral. There is a massive amount that can be done in this area to invest in smart housing technology for all families to militate against the climate emergency – Nothing.
Fail all round.
Conclusion
So no grand future mission statement about nation building in a time of a massive health crisis and a climate change crisis.
Supply-side policies emphasised that never really work but are ideologically in keeping with the conservatives.
The foresight of the Government and the care for the people it is elected by is severely exposed in this fiscal statement.
That is enough for today!
(c) Copyright 2020 William Mitchell. All Rights Reserved.
“The fiscal deficit is projected to fall from $A10,141 million in 2017-18 to $A4,162 million in the current financial year (2018-19). By 2019-20, a surplus is estimated of some $A7,054 million, increasing thereafter.
The Treasury estimates show the government will increasingly reduce its contribution to growth in the remaining years of the forecast period until 2022-23, when the fiscal surplus is projected to be 0.4 per cent of GDP.”
That text doesn’t match up with the graph below it.
And “The first shows the increases in disposable income for a person earning $A50,000 per annum” should be $23,400
Have we got a point by point demolition of the supply-side economic belief?
It cannot possibly work if there is any leakage to net savings – which we know occurs as a function of any modern monetary system. Those savings have to be offset as they cannot be reduced by confiscation (people just reduce their spending to maintain their security buffer, etc) or by pushing debt (because people will only borrow when they know they can pay it back!).
And how can there be any real crowding out effects if you’re hiring the unemployed in such a way there will be no price response if the private sector decides to poach them?
I sometimes feel as though we are in the middle of a Monty Hall problem and we keep showing people the door with the goat behind and still they refuse to change their choice.
Perhaps we should rename it Monty’s Money Theory. We wouldn’t even have to change the acronym.
Thanks, Bill, for highlighting in specific terms the key changes in Australian economic policies and programs you see as vitally necessary and feasible right now. While I haven’t yet finished the book, I’ve read enough of “Evil Geniuses” by Kurt Andersen to recommend it as an insightful history of how, in America, structural and cultural changes in the 1970s and 80s, largely unnoticed or acquiesced in by average citizens, paved the way for the vicious hyper-capitalist economy now prevailing in the exceptional nation. So far, “Evil Geniuses” strikes me as a kind of America-centric version of “Reclaiming the State,” an explanation of how average citizens allowed themselves to be played by elites, buying into glib explanations of how apparent neoliberal wreckage would work out just fine in the long run, was nothing but a normal example of historical capitalist destruction which had always cleared the road of progress. I get it that things aren’t all that good in Australia and may well be getting worse, but Australians and citizens of other “developed” nations are a light year ahead of Americans in their chance to ameliorate and survive the socioeconomic ravages, post-Covid, about to rip through the already precarious lives of the working class and the even more marginalized. That said, I’m still looking for that grand and glorious vision of a humane, egalitarian, ecologically-sensitive society operated according to MMT principles. Again, I state my conviction that such a comprehensive and compelling vision would sell MMT to the public, perhaps even to some less-sold-out politicians, much more quickly and effectively than all the economic theory and analysis in the world.
“I’m still looking for that grand and glorious vision of a humane, egalitarian, ecologically-sensitive society…”
Newton
It’s already out there, I submit. Its author was E.F.Schumacher and its title is “Small is beautiful: A Study of Economics As If People Mattered”, Doubtless you’re aware of it.
“… operated according to MMT principles”.
Willing the end (ie implementing Schumacher’s programme) would be one thing, willing the means quite another. Whilst if an understanding of MMT’s tenets were already to be present that would certainly result in taking that step being seen in a more positive light politically (if only because it would mean that the doomsayers’ voices crying “but how will we pay for it” would be filtered-out), that needn’t be a prerequisite. The crucial – and the hardest – hurdle to get over is winning acceptance of the vision by the public in the first place.
Of course it’s entirely possible to advocate for an MMT-informed public and a political class alive to the full scope of the enlarged policy-space which such awareness would bring – to think out of the box, to innovate, to reform, etc – for the sake of the desperately-needed improvement that would bring about in the health and functioning of our political institutions. Although more modest than the grand one you’re seeking, I would argue that that is as worthy a vision in its own right and furthermore, I venture to suggest, one more likely to be attainable.
Some aspects of the federal budget are puzzling. Lowering income tax for instance.
According to conventional wisdom all government revenue, taxes & charges etc, flow into the Consolidated Revenue Fund which supposedly funds day to day government business.
Decreasing income tax rates further would only decrease the amount in the fund and lessen the ability of government to fund all its current services. (Unless defunding government services is the aim).
I know professor B. tells us taxes are just binned so the CRF can’t fund government services.
Can someone in the know please explain the actual function of the Consolidated Revenue Fund?
“Decreasing income tax rates further would only decrease the amount in the fund ”
That assumes a fixed amount of transactions. Remember that my spending is your income less tax and your spending is my income less tax. A smaller tax rate just means more spending, and more transactions.
There is surprisingly little variation in the total tax take to adjustments in the tax rates. That’s because the total tax take is driven by how much the non-government sector wants to save, not by the tax levels. If the non-government sector doesn’t want to save at all then the budget will be balanced for *any* positive tax rate. It’s a simple geometric progression – like a stone skipping across a pond.
Low tax rates are like having a smooth stone and you get more skips across the pond. High rates are like having a rough stone and fewer skips across the pond. The total ‘tax’ collected by the ripples is the same in both cases – hence why both stones will sink.
The CRF is just a ledger where the government accounts for the transactions it undertakes. The balance on it has little meaning, since the only power that can say “stop” at any particular point is Parliament, and that is controlled by government or they wouldn’t be the government.
@Neil Wilson; Friday, October 9, 2020 at 16:26
“Remember that my spending is your income less tax and your spending is my income less tax. A smaller tax rate just means more spending, and more transactions.”
Maybe, but not if the funds simply go to paying down debt. I suppose the higher rate earners the Liberals are paying out might spend it on property or stocks and they might pay associated taxes as a result. But they probably won’t be paying it to GST.
“Maybe, but not if the funds simply go to paying down debt.”
That’s just “That’s because the total tax take is driven by how much the non-government sector wants to save, not by the tax levels”
Paying off private debt is just a form of saving.
“It’s a simple geometric progression …”
Also bounded and absolutely convergent.
Forget all the handouts and tax cuts ..
Put the 1trillion into infrastructure and building a secondary industries instead of hand outs
We must not export all out natural resources we must value add here not let others benefit
We must start down the road to self sufficiency.
Ensure all companies pay their taxes, I mean
all why does the government turn a blind eye to the multi’s who pay no tax why are they here ????
the people of Australia are being duped…
why ?
A weak government…
There is so much to read and take in. You may be interested if I tell you that age forty eight (I’m now 65) I was diagnosed with adult attention deficit disorder. I had great difficulty reading and taking in all that you’ve said. I do have enough information to know that I wish to keep in contact with you. We think in much the same way!