Today (January 22, 2026), the Australian Bureau of Statistics (ABS) released the latest labour force…
A Job Guarantee ensures there is always a job for the unskilled
Economists often use the so-called Unemployment-Vacancy (UV) ratio, which is the number of official unemployed divided by the number of unfilled vacancies at any point in time, to measure the strength of the labour market. The latest data from the Australian Bureau of Statistics (ABS) shows that the UV ratio in Australia is currently at 4. This means that there are four unemployed workers per unfilled vacancy – a sign of a relatively weak labour market. However, a new Report from Anglicare researchers in Australia, which was released yesterday, shows that when we disaggregate the analysis and examine a match of vacancies by worker in each skill level, the UV ratios for the most disadvantaged workers is much higher. The obvious solution for the federal government is to introduce a Job Guarantee, which effectively ensures the UV ratio for the most disadvantaged workers would be equal to unity. In other words, there would always be a job opportunity available that would suit the most unskilled worker in the nation. That is what today’s blog is about.
Previous blogs on this topic include:
1. Latest Australian vacancy data – its all down to deficient demand.
2. Serial liars who stand for nothing that is worth supporting.
3. Labour market deregulation will not reduce unemployment.
5, Extending unemployment benefits … an omen.
6. Nobel prize – hardly noble.
Australia’s UV ratio
The Australian Bureau of Statistics (ABS) released the latest – Job Vacancies, Australia, Aug 2016 – data on September 29, 2016.
Both private and public sector vacancies remain well below the previous peak in the February 2011 quarter, although they are continuing to grow (in a subdued fashion) since the most recent trough (August-quarter 2013).
The peak to trough movement was deliberately created by the federal government’s fiscal shift in 2012 towards austerity. As the economy started to slow appreciably and unemployment started to rise again, the new government abandoned its attempt to impose even more austerity and allowed the fiscal deficit to increase and support renewed growth.
The growth was modest but allowed unfilled vacancies to expand. In recent quarters, the rate of expansion has slowed again, particularly in the private sector.
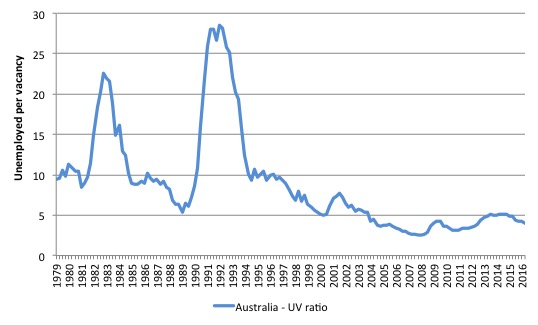
The following graph shows the overall Unemployment-Vacancies (UV) ratio in Australia for the period May 1979 to September 2016. You can see the impacts of the two major recessions in this period (1982 and 1991).
The UV ratio is now of 4.04 – that is, around 4 unemployed persons per unfilled job – and it has dropped a little after hovering around 5 for some time.
You can see that after the GFC hit and the federal government introduced its large fiscal stimulus, the UV ratio fell to 3.09 (February-quarter 2011).
But it then rose back to a new peak of 5.2 (August 2014) after the Australian government went into austerity mode in its obsessive (failed) pursuit of a fiscal surplus. While that pursuit was in vain it undermined aggregate demand and the labour market has weakened considerably ever since.
Both sides of the hump that peak in the August-2009 quarter tell you are story about the effectiveness of fiscal interventions.
Before the stimulus package was introduced, the Australian labour market was heading into crisis as the UV rose and the economy headed into recession.
After the 2009 peak, the fiscal stimulus started to support the economic recovery and the UV ratio fell.
After that point, with no structural changes obvious, it is hard to argue that the rising ratio was the result of anything other than a declining aggregate demand situation – that is, a lack of job creation.
The current UV ratio is low relative to the peak of May 1992 when the ratio was 29, but it remains the case that there are many more people unemployed competing for scarce jobs than there were before the crisis started to impact.
Further, underemployment is now much higher than in 1982 (when it was largely non-existent) and 1991 (when it started to rise to current levels) and so the unemployed now have to compete for jobs with new entrants, other unemployed and the 1.1 million underemployed (8.8 per cent of the labour force).
Unemployment dancing to labour demand
To push the argument that aggregate demand drives unemployment, which is contrary to the mainstream narrative that implicates structural shifts and changes in worker attitude towards leisure, we can explore the relationship between unemployment and labour demand.
The IMF and the OECD among other neo-liberal institutions regularly bang on about the need for more structural reform in the labour market to sure unemployment.
The extreme versions of this narrative claim that growth is being constrained by the labour market – where an unwillingness of workers to work at current wages and excessive regulation maintains high rates of unemployment.
This conveniently diverts attention from the fact that firms will only employ labour if they can sell the production that is created from that extra employment.
The IMF regularly insists that governments should further deregulate the labour market to allow “bosses and employees choice” to determine optimal arrangements.
Experience tells us that this just means the IMF wants to do away the what protections that workers still enjoy and give the bosses an open field to extract more work effort, pay less, offer less secure work and give the workers no alternatives.
Australia is already becoming a part-time employment nation (see Australian labour market – continues to deteriorate – fiscal stimulus needed) where full-time employment is collapsing and being replaced by precarious, low-pay jobs.
Further, despite all the evidence to the contrary, the neo-liberals continue to wheel out the worn-out notion that unemployment is a result of supply-side constraints that have to be eliminated through deregulation and harsher work tests including denial of benefits to people.
Apparently, the income support the Australian government provides in the form of unemployment benefits (which is below the accepted poverty line anyway) provides a life of luxury that the unemployed find compelled to accept. In doing so, they allegedly give up looking for work.
The reality is that unemployment is typically an aggregate spending (demand) phenomenon – that is, it reflects a systemic failure to create enough jobs as a result of total spending being below the level necessary to generate sales that will provide jobs for all those who desire work.
The standard supply-side position – which claims unemployment is the choice workers make when they prefer leisure to work – has been exposed over several decades to be a false depiction of how unemployment occurs.
Further, it is difficult to mount a search-based explanation for mass unemployment when there are not enough jobs being generated relative to labour supply.
It is impossible to mount a structural explanation (for example, excessive unemployment benefits) when there has been no change in structure over the time unemployment has risen or fallen.
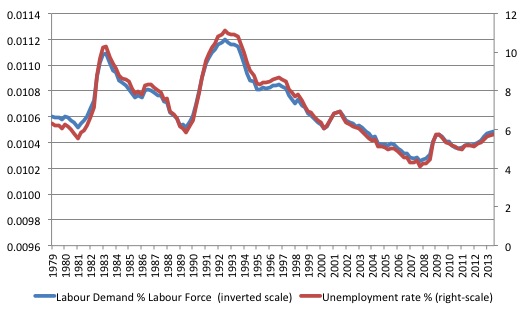
In the following graph, we show the unemployment rate is plotted on the right-hand scale against the sum of employment and vacancies (as a percentage of the labour force) as a measure of labour demand on the left-hand scale (inverted to show the correspondence between the two series). The data is from the May-quarter 1979 (the longest coherent vacancies series that is available) to the September-quarter 2016 (that is, the data incorporates the latest vacancy information).
The correspondence between the two series is striking and the variation in the unemployment rate (turning points etc) is closely associated with the evolution of demand.
If unemployment rates were the result of supply-changes (such as preferences for work, or welfare benefits etc) then this close correspondence would not occur. The fact is that unemployment is the driven by insufficient demand for labour, which, in turn, is driven by aggregate spending (demand) deficiencies.
The late Franco Modigliani presented similar graphs for France, Germany, and the United Kingdom, which shows that as job availability declines the unemployment rate rises, with the concomitant outcomes that the search process lengthens as does the average duration of unemployment.
Modigliani (2000: 5) concluded:
Everywhere unemployment has risen because of a large shrinkage in the number of positions needed to satisfy existing demand.
Reference: Modigliani, Franco (2000) ‘Europe’s Economic Problems’, Carpe Oeconomiam Papers in Economics, 3rd Monetary and Finance Lecture, Freiburg, April 6.
Where data is available, you could draw similar graphs for most nations.
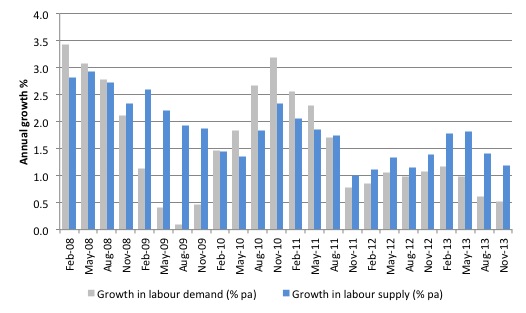
The next graph shows the growth in labour demand and labour supply (measured as the growth in the labour force) from the February-quarter 2008 to the August-quarter 2016 (the current cycle).
The impact of the fiscal stimulus in 2010 and into 2011 is clear as is the withdrawal of the same and the slowdown in investment in mining in more recent quarters.
The supply-side growth has fallen sharply in recent quarters as a result of the sharp decline in the participation rate as employment growth has been subdued.
As a result, the supply-side depicted in the graph underestimates the actual available labour because it ignores the fact that hidden unemployment has risen.
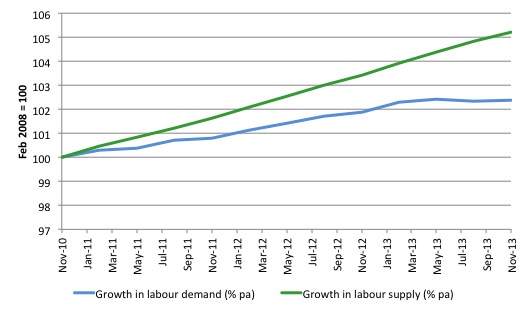
The next graph shows the evolution of labour demand (as defined above) and labour supply (standardised at the November 2010 peak labour force participation rate). In November 2010, the labour force participation rate was 65.8 per cent and it is now 64.7 per cent.
That amounts to some 191 thousand workers who have left the labour force over the time, most of them due to the lack of job opportunities.
The calculation for the supply index is simple – take the actual working age population in each period after November 2010 and find out what the labour force would have been had the participation rate remained at its November 2010 peak. Then express that potential labour force in index terms (the green line).
Its linear nature reflects only the growth in the working age population with the cyclical shifts in participation eliminated.
The increase in the gap between labour demand and labour supply relative to the gap in November 2010 is 730 thousand as at the September 2016. The actual gap that existed in November 2010 was approximately 403 thousand.
Also note the demand side measures persons employed and unfilled vacancies. If we expressed employment in Full-Time Equivalent terms the picture would be far worse given the rise in underemployment. Remember, to be counted as employed one only has to work one hour or more a week.
But what about the disadvantaged workers?
The previous analysis is at the aggregate level so when we say the UV ratio is equal to 4 we are simply dividing the number of unfilled vacancies (of any skill level) into the total number of unemployed (irrespective of background and qualifications).
A new piece of research released yesterday by the Anglicare organisation sheds light on the situation at the disaggregated (by skill) level.
The research was published in two separate documents:
1. 2016 State of the Family Report – Positions Vacant: When the Jobs Aren’t There.
2. Jobs Availability Snapshot.
The latter report examines how the recent labour market trends:
… affects the most disadvantaged and marginalised working age members of Australian society.
It refutes the idea that:
… people without work are entirely responsible for their own circumstances, and that they could and should try harder and more successfully to get a job.
Its “target group … is people who have extra barriers to entering the work force due to low levels of skills, experience or qualifications. That may because they grow up with ill heath, a history of trauma, poor literacy, or family dysfunction, or because the industry they have worked in all their lives has disappeared.”
The Report matched the Australia and New Zealand Standard Classi cation of Occupations (ANZSCO) (“a typology of all potential positions in the labour market”) with the Internet Vacancy Index (IVI), which “examines the distribution of currently advertised positions, by ANZSCO skill level”.
I should note that the vacancies they examine are from a different dataset than the ABS aggregate vacancy data discussed above.
The Report found that in May 2016:
1. “the proportion of higher skill level jobs available in the Australian labour market has grown over the past 10 years, while the proportion for people with lower level skills and experience has fallen, and the divide is growing.”
2. “37% of all positions advertised were at the top skill level, and only 13% were for skill level 5”. Skill level 5 is the lowest in the classification.
3. “there are more than six disadvantaged jobseekers for every vacancy at skill level 5 across Australia. In South Australia there are more than nine and in Tasmania ten and a half.”
Point 3 is significant. While the aggregate UV ratio is currently 4 (4 unemployed to each unfilled vacancy), the disaggregated data shows that for disadvantaged workers, the UV ratio is much worse.
For Tasmania, it means there are 10.5 low-skill workers for every tenable job vacancy.
4. “While only 13% of advertised vacancies were for people at the lowest skills level, 27% were for skill 2 level 4 positions. This suggests disadvantaged job seekers could really benefit from high quality training and experience in paid work; both for the obvious capacity reasons and as a positive signal to employers.”
But do not be seduced into thinking that the ‘activation’ mantra from bodies like the OECD and the IMF, which claim that training is the way forward is supported by this result.
As the Report says – “were all disadvantaged job seekers to reach a skill level 4 there would still be two for every advertised job”.
And it is even worse than this:
… given the substantial growth in part-time rather than full time employment and the record number of underemployed people looking for more work, people with higher level skills will also be competing for these jobs.
Please read my blog – The unemployed cannot find jobs that are not there! – for more discussion on this point.
In the face of an overall jobs shortage, increased training merely shuffles the unemployment queue. I use the – 100 dogs and 94 bones parable – to make that point.
The main reason that the supply-side approach is flawed is because it fails to recognise that unemployment arises when there are not enough jobs created to match the preferences of the willing labour supply. The research evidence is clear – churning people through training programs divorced from the context of the paid-work environment is a waste of time and resources and demoralises the victims of the process – the unemployed.
Imagine a small community comprising 100 dogs. Each morning they set off into the field to dig for bones. If there enough bones for all buried in the field then all the dogs would succeed in their search no matter how fast or dexterous they were.
Now imagine that one day the 100 dogs set off for the field as usual but this time they find there are only 94 bones buried.
Some dogs who were always very sharp dig up two bones as usual and others dig up the usual one bone. But, as a matter of accounting, at least 6 dogs will return homebone-less.
Now imagine that the government decides that this is unsustainable and decides that it is the skills and motivation of the bone-less dogs that is the problem. They are not “boneable” enough.
So a range of dog psychologists and dog-trainers are called into to work on the attitudes and skills of the bone-less dogs. The dogs undergo assessment and are assigned case managers. They are told that unless they train they will miss out on their nightly bowl of food that the government provides to them while bone-less. They feel despondent.
Anyway, after running and digging skills are imparted to the bone-less dogs things start to change. Each day as the 100 dogs go in search of 94 bones, we start to observe different dogs coming back bone-less. The bone-less queue seems to become shuffled by the training programs.
However, on any particular day, there are still 100 dogs running into the field and only 94 bones are buried there!
The Anglicare Report recommends:
1. Invest more in skill development – I concur – the state should provide resources to allow every person to reach the maximum of their potential. We should aim for zero waste of every citizen.
2. “to make appropriate employment creation an immediate priority in both South Australia and Tasmania”. Why stop at South Australia and Tasmania. Every state and territory has a shortage of jobs. See next section.
3. “There is every reason to ensure that those people who are excluded from the workforce can access an adequate income to improve the education, health and wellbeing of themselves and their families; and to put them in the best position to find and keep employment should the opportunity arise.” See next section.
Why the Job Guarantee should be part of the solution
The Anglicare Report is in my opinion fairly light on recommendations. The scale of the problem we are discussing is massive. There are more than 2 million people in Australia without enough work in a labour force of just 12 million.
That is in excess of 16 per cent of the available labour force is being wasted.
Extra training, limited job creation, and viable income support measures, as recommended by the Report, are an inadequate response to the scale of the disaster before us.
The first major intervention should be the announcement by the Federal government of a Job Guarantee, which would unconditionally provide a minimum wage job to anybody who could not find work elsewhere.
The Job Guarantee wage would allow the recipient to enjoy a socially-inclusive existence and would be accompanied by social wage measures, including subsidised childcare, public transport, and education.
For people unable to work, income support should ensure a similar socially-inclusive existence is possible.
The Job Guarantee has to be designed in a way that the jobs on offer are available to the most disadvantaged workers in the labour market.
In a sense, the UV ratio for the most disadvantaged becomes unity. That is, there would always be a job match for every unemployed, low-skilled worker.
At higher skill levels, there would be some mismatch in the type of work offered by the Job Guarantee and the worker seeking the job. However, typically persistent unemployment is confined to the lower skilled workers and high skilled workers often can transition between jobs using redundancy payouts.
But in a deep recession, where private investment collapses, more skilled workers might find themselves subject to what we call skill-based underemployment if they sought work within the Job Guarantee.
Of course, the government has the fiscal capacity to ensure that no recession ever deepens to the point that skilled workers find themselves unemployed for extended periods of time.
Conclusion
The Anglicare Report is very valuable because it sheds light on problems that the aggregate data shields.
At the aggregate level, the UV ratio of four is bad enough. But when you dig down deeper, as the Anglicare research shows, the disadvantaged face much tougher times in a recessed labour market.
That is enough for today!
(c) Copyright 2016 William Mitchell. All Rights Reserved.


“However, on any particular day, there are still 100 dogs running into the field and only 94 bones are buried there!”
All very true. But unfortunately that is the point.
If you have a bunch of people on minimum wage jobs and another bunch of people on nothing, then if you shuffle them up a bit you end up with most of the people working some part of the year on minimum wage. And that effectively reduces the minimum wage on an annualised basis.
That then allows you to play games like increasing the minimum wage while allowing temporary, part time and zero-hours contract work to increase (plus false self-employment). These all shuffle the unemployment around so few feel they are actually unemployed – just a bit unlucky in the jobs market.
It’s a deeply cynical use of dynamics.
Your namesake, Rodger Malcolm Mitchell is no fan of a job guarantee scheme. see here;
I assume you are aware of it? What do you say in response?
Regards John
http://mythfighter.com/2012/05/29/why-modern-monetary-theorys-jobs-guarantee-is-like-the-eus-euro-a-beloved-solution-to-the-wrong-problem/
The unemployment/vacancy is a problem in Canada as well. We are at 7% unemployment with a population of 36 million implying that we have at least 2 million out of work people when you add in the discouraged workers. Employers are required to advertise job postings and there never seems to be more than about 100,000 such ads out there these days and those numbers seem to be in decline.
Taxes create the fiscal space to allow the govt to spend. Put another way, taxes create unemployment so a percentage of the population will seek public sector work. So if the govt is creating the unemployment, shouldn’t the govt be obligated to employ all those put out of work by its taxing policy? A job guarantee should also be a moral obligation of govt.
Markg:
Taxes are still needed to support the demand for the national money even though we have unemployment. Taxes drive fiat money, but it’s not clear to me how much taxation is needed to do that.
At the sub national level the governments (provincial, territorial, municipal) debts are being serviced by taxation and the job guarantee would increase their tax bases making that task significantly easier.
Politically it’s easier to just increase deficits to back the jobs guarantee and come clean with the public about MMT and the true need for taxation which won’t go away.
Given that MMT describes the monetary reality to a T, there is no doubt that government has a moral duty to provide a job guarantee. The duty to use the governments sovereign money issuing capacity for the public good is actually a constitutional requirement in some cases although it can be masked in rather archaic language.
One way for the JG to deal with skill-based underemployment is to have pay grades. The government would commit itself to hiring every applicant at the highest pay grade for which the applicant is qualified. The qualification for the lowest pay grade is simply showing up, but, at higher pay grades, explicit objective criteria regarding school degrees and/or licenses and/or standardized test scores, drug tests, and criminal background checks would kick in. Fadhel Kaboub proposed a three-tier JG wage scale of $15, $18, and $21 per hour. http://neweconomicperspectives.org/2013/08/honoring-dr-kings-call-for-a-job-guarantee-program.html
Because the JG employees in higher pay grades would do more-skilled work, the additional value of the goods and services they produce would back up the increased demand injected into the economy from their higher pay and prevent an uptick in inflation. For example, when the tech bubble bursts and a lot of IT workers lose their jobs, the government could run pilot factories that would be applied R&D centers to use robotics and 3D printing to manufacture important products that are now technically feasible but not profitable to produce, such as lithium-ion batteries and photovoltaic cells.
J Christensen.
Yes we need taxes to drive the currency but also to redistribute access to real wealth ,claims
on others labours by limiting the spending power of the wealthy.
Full voluntary employment can only help egalitarian social justice but societies have achieved
full employment before (indeed unemployment is a very recent phenomenon in the history of mankind
and even under capitalism has in some periods in some places been very low) and tyranny and injustice
has still prevailed’
100 Dogs Parable – v2.0?
the system actually allows 100 dogs that already have bones, but who want new ones, to also compete for the 96 available bones against the 100 dogs that don’t have a bone but need one.