I grew up in a society where collective will was at the forefront and it…
Same old story – poor getting poorer and more indebted and the rich …
I have started to research the idea of the disappearing or shrinking middle class as part of a book project (for 2015) I am amassing materials for. The idea is simple but the conceptualisation and demarcation of the idea is rather complex. The hypothesis is that Capitalism is now striking at the income and wealth segment that has helped give it stability (which in this sense relates to not having a revolution rather than eliminating major economic cycles and mass unemployment). Marx said that religion was the opiate of the masses that kept them in line whereas in modern times it is mass consumption and credit that seems to keep the middle class in line. The rise in income and wealth inequality over the last 3 decades under the watch of neo-liberalism is obvious and initially showed up as a widening 90/10 gap (the numbers being deciles in the relevant distribution). But as the lowest income groups were marginalised, the dynamic moved on and started hollowing out the middle deciles. Real wages have lagged well behind productivity growth and mass unemployment is infiltrating the middle-income cohorts who typically have superior education, which has insulated them from job loss. The US Census Bureau provides excellent data on – Wealth and Asset Ownership, which allows us to trace the trends in household net worth and debt in the US in some detail. This blog just documents some of the characteristics of those distributions – it is preliminary work for me but of interest nonetheless.
In his famous tract, – Politics – written in 340BC, Aristotle emphasised how important he considered the middle class to be as a source of stability.
He wrote in Book 4:
Thus it is manifest that the best political community is formed by citizens of the middle class, and that those states are likely to be well-administered in which the middle class is large, and stronger if possible than both the other classes, or at any rate than either singly; for the addition of the middle class turns the scale, and prevents either of the extremes from being dominant. Great then is the good fortune of a state in which the citizens have a moderate and sufficient property; for where some possess much, and the others nothing, there may arise an extreme democracy, or a pure oligarchy; or a tyranny may grow out of either extreme- either out of the most rampant democracy, or out of an oligarchy; but it is not so likely to arise out of the middle constitutions and those akin to them. I will explain the reason of this hereafter, when I speak of the revolutions of states. The mean condition of states is clearly best, for no other is free from faction; and where the middle class is large, there are least likely to be factions and dissensions. For a similar reason large states are less liable to faction than small ones, because in them the middle class is large; whereas in small states it is easy to divide all the citizens into two classes who are either rich or poor, and to leave nothing in the middle. And democracies are safer and more permanent than oligarchies, because they have a middle class which is more numerous and has a greater share in the government; for when there is no middle class, and the poor greatly exceed in number, troubles arise, and the state soon comes to an end. . . .
It is arguable, but my hypothesis is that we were able to tame the raw greed of capital in the Post World War II via social democrat governments because there was a growing middle class that not only benefited from the growth in mass education (in particular, university education) but also became involved in the political process at all levels.
There was a sense of equity through the collective action and responsibility in most nations as a result of the mediating role that governments played between capital and labour. The middle class became important because its growing importance in political life and its ability to influence the policy making process at local government through to national government did reduce the capacity of capital to openly oppress the poor and capture huge swathes of national income for themselves.
But that didn’t last. There has been a massive contraction of ‘lower middle class’ occupations – for example, bank officers and the attacks on government employment have hollowed out the public sector.
There is a lot to work on in this area of research and I will report what I find over time.
In the publication, Changes in Household Net Worth from 2005 to 2010 – the US Census Bureau says that:
Household net worth or wealth is an important defining factor of economic well-being in the United States. In times of economic hardship, such as unemployment, illness, or divorce, a person’s or household’s financial assets (e.g., savings accounts) are an additional source of income to help pay expenses and bills. For individuals and households with a householder 65 years and older, wealth is also an important source of post-retirement income.
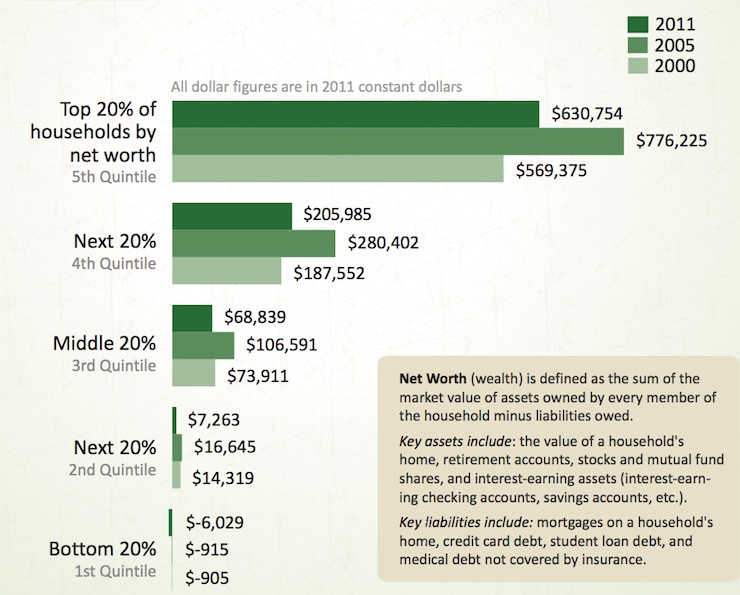
To start with, this graphic was published by the US Department of Commerce from data collected by the US Census Bureau. The actual publication (August 21, 2014) – Gap Between Higher- and Lower-Wealth Households Widens, Census Bureau Reports – discusses how:
… Median net worth increased between 2000 and 2011 for households in the top two quintiles of the net worth distribution (the wealthiest 40 percent), while declining for those in the lower three quintiles (the bottom 60 percent) …
A “Quintile is the portion of a frequency distribution containing one-fifth of the total sample. Each quintile represents 20 percent, or one-fifth, of all households”.
The graphic demonstrates that the crisis has been particularly bad for the wealth holdings of the bottom 60 per cent of wealth holders.
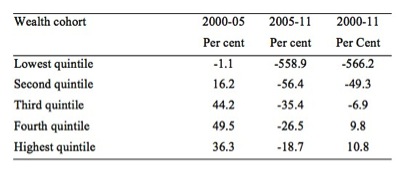
The following table shows the percentage changes between 2000-05, 2005-11 and 2000-11 in Median Wealth for the 5 quintiles captured in the above graphic.
The two highest wealthiest quintiles expanded their wealth over the whole period and lost the least proportionately in the crisis period when compared to the poorest Americans.
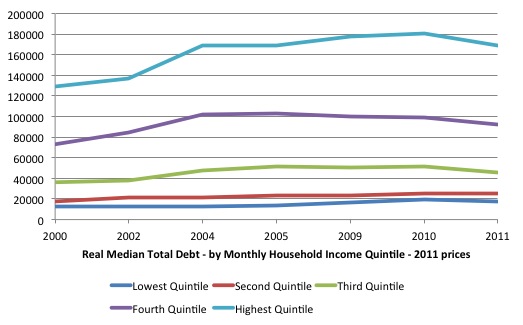
The US Census Bureau data also allows us to track the evolution of household debt from 2000 to 2011 across a number of different characteristics. For this blog, I chose to look at how the income quintiles have tracked in terms of median debt levels in real terms. In this case, the quintiles are arranged in terms of Monthly Household Income.
We use 2011 prices to compute the real value of the various years. The CPI-U from the US Bureau of Labor Statistics was used to deflate the various monetary values.
The first graph shows the total median debt holdings in real terms between 2000 and 2011. The lowest quintiles again have increased their real debt burdens in proportionate terms relative to the highest two quintiles.
Over the full period (2000-11), real median debt grew by 46.4 per cent for the Lowest Quintile, 41.8 per cent for the Second Quintile, 26.9per cent for the Third Quintile, 25.6 per cent for the Fourth Quintile and 30.8
per cent for the Highest Quintile.
In terms of deleveraging since the crisis, the Lowest Quintile has increased their total median debt levels by 6.7 per cent between 2009-11, the Second Quintile has increased the median level by 8.4 per cent.
The remaining three quintiles have reduced their debt levels by 8.6 per cent for the Third, 7.6 per cent for the Fourth and 4.6 per cent for the Highest.
So not only are the lowest quintiles becoming poorer but they are also becoming more indebted.
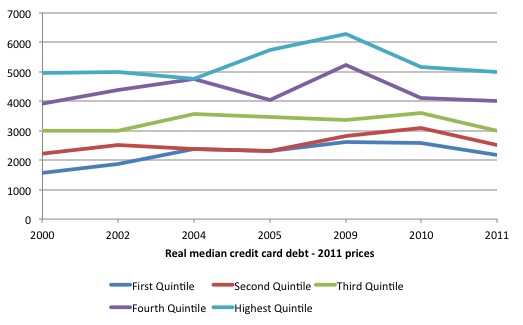
A closer examination of the data showed that there was a major rise in unsecured real credit card debt between 2000-11 for the Lowest income quintile (39 per cent) compared to 12.6 per cent for the Second Quintile, 0.15 per cent for the Third Quintile, 2.1 per cent for the Fourth Quintile and 0.7 per cent for the Highest Quintile.
Since 2009 (until 2011), the retreat from credit card exposure has not been proportionate. The Lowest income quintile reduced their exposure by 16.8 per cent, compared to 11.7 per cent for the Second Quintile, 10.6 per cent for the Third Quintile, 23.7 per cent for the Fourth Quintile and 20.5 per cent for the Highest Quintile.
Conclusion
As I noted at the outset, this is just exploratory type of work that underpins all research. I don’t have any answers yet, just an accumulation of facts. Of-course, I have a framework I am viewing these facts within and have written about that extensively.
The reality is that the poor are getting poorer and more exposed to economic fragility while the rich are getting richer and insulating themselves somewhat from economic uncertainty.
Although I read a report today that I am following up on that shows the growth of margin debt in the US sharemarket boom is at record levels. More on that when I know more.
That is enough for today!
(c) Copyright 2014 Bill Mitchell. All Rights Reserved.


Good topic for a book. In particular, MMT needs a strong counter-narrative to the right’s stagflation view of the 70s, which I see as merely as a perversion of the evidence in order to blame the labor and middle classes for the malaise then. (It’s probably also a good idea that this counter-narrative be firmly established soon, as we are running out of people who actually experienced that time as working adults, and understand what it was like first hand.)
I like this idea for a book a lot. I worry for the future of my children and grandchildren.
Does the data exist to show how widespread this effect actually is around the world and identify those nations affected?
Could it be contrasted with what is happening in the BRICs etc in some way?
In most places, there is no middle class anymore. We’re all working poor.
If electorate’s could recognize context, that shouldn’t be so bad. It’s all in the details of how much work, and how poor in options we choose to be.
The history of biological evolution is dominated by those species that fully invest what they harvest.
(Those “successful” ones, which uselessly over-sequestered assets, & over adapted to transient contexts … are all extinct.)
We should all be working poor. As should every nation.
Options count more than foregone (i.e., hoarded) fiat.
http://mikenormaneconomics.blogspot.com/2013/12/conflating-current-fiat-with-future.html
Excellent data? Ironic, how well we document our own demise …. WHILE DOING NOTHING ABOUT IT!
Data means nothing to mules …. without an accompanying 2×4? To get their attention, to context & meaning?
I’m afraid that it will take more than a 2×4 to get the necessary messages through to the Australian sheeple,no matter what class they belong to.
In the main they are too busy climbing onto the Bogan Bus (Brisbane – Denpasar),veging out in front of the idiot box and other mindless pursuits.
There is some interesting material in this paper from the Centre for Labour and Social Studies (CLASS) in the UK on the importance of wages for equality and sustainable growth. Author would seem to be in the Post Keynesian/Kalecki mould. http://classonline.org.uk/docs/2014_Wage-led_development_-_Ozlem_Onaran.pdf
“Finally, the neoliberal shift in macroeconomic policy away from a broad focus on full
employment to a narrow focus on inflation targeting and tight fiscal and monetary policy
in the post-1980s has been detrimental for growth, as well as labour’s bargaining power
and equality. Reorienting macroeconomic policies towards full employment is important
for not just rebalancing power relations but also for rebalancing the economy. “
So why bother, eh, Podargus?
A book targeted at University-age youth who actually do care about their future would be far more effective than a book targeted at academics.
Was ‘Don’t trust anyone over 30’ a saying of your generation or the next one?
I am surprised that nobody has mentioned Piketty here in this context. I have not had the opportunity to read his book yet, only some reviews, but right or wrong his discussion seems to be relevant.
MMT states quite correctly that government debt or financial assets are irrelevant because the government can create or destroy money freely as it sees fit. We know that the government annual deficit or surplus is exactly the increase or decrease respectively of the net financial assets (NFA) in the country’s currency in the non-government sector, domestic plus external. This is an alternative statement of the sectoral balance law. The usual comment is that the deficit should be limited by the risk of inflation although I think there are additional factors that should be considered.
What is not usually discussed (although the book mooted by Bill here goes towards this) are other effects of the magnitude or rate of change of the NFA and how the NFA are distributed within the non-government sector. This probably can only be discussed properly in conjunction with the distribution of the non-financial assets, i.e. the real assets, which would include anything like shares or property which provide an income and/or store wealth.
It is quite common for householders to have negative NFA, for example those young adults who have just bought a house with a bank loan. I have not seen a complete analysis of this yet, but it seems that for that group of people the Piketty effect would take hold. That is, if the interest rate is greater than the increase in GDP, that group would continue to lose financial assets.
It’s a bit simplistic, but we can more or less divide the community into lenders and spenders. If the householders who are the spenders are in debt, then they lose out to the lenders, who tend to be the wealthier people (bank share holders, etc) and the wealth differences increase.
My ideas on this subject are a bit vague at present but I think further analysis would be very useful.
It is worth listening to Prof. Richard D. Wolff on this issue. He has quite a bit to say recently on the collapse of the American middle-class. This collapse is more advanced than Australia’s so it shows us where we are headed. Wolff is a Marxist. Give him a hearing. His analysis of modern capitalism makes a lot of sense. He explains, for example, why the USA is losing manufacturing to China. He explains why the West is going backwards in relative terms.
Matt B, I don’t know where you dream’t up the generation idea. Surely not from my rather (cynically) light hearted comment.
Maybe you are a Gen X or Y who seem to have a generation complex,usually to justify their belief that they are being extraordinarily hardly done by.
As for targeting books at a particular group,I doubt if it really matters. Only a certain minority of any group will consider the common good before their own interests. And from my observation the present “University-age youth” are certainly no exception to this rule.
Ikonoclast, thanks for the reference to Richard Wolff. I listened to one of his interviews and he seems very interesting. I will follow that up further.
Progressive taxation (without loopholes for the wealthy) is the primary way to deal with this.
@Ikonclast
The “west” has been going backwards since the Cecils started whispering sweet nothings into Lizies ears.
Why were many English fascinated with little island economic ecosystems of the early 20th century such as The Great Blasket somewhat divorced from the Tudor capitalistic experiment ?
The people seemed somewhat familiar yet different.
Many of us have come to realize that we are the abenormal types and people with distance from this demonic scarcity engine hold a certain humanity.
Basic human scale exchange is now as dead as a dodo.
These islands were finally changed by the Keynesian war experiment known as the Great war – the debris from various sinkings produced such a physical goods surplus that money in large quanity was needed to express the bounty in monetary terms.
Totally changing the island dynamic within a few short years.
The last boy who left the island in 1953 (known as the Lonelist boy in the world) was recently interviewed in a Dingle pub .
He had become westernized as you call it and wanted to leave the place.
He expressed fascination with the lights of mainland buses across the barrier of water and equated this with “progress”
Well progress as we define it in the post enclosure period is nothing more then a illusion.
The product of a bargain with Mephisto.
The mainland town of Dingle is now a materialistic wreck of a gaff without enough material.
A anti cultural hole of place with neither culture nor internal money to bind it when once it had 52 pubs in which you could have a quiet or musical pint.
Now you cannot have either music or quietness , just Mammon without the good stuff in between.
The Middleclass life was / is a consumer serfs life.
A living suburban hell projected on us poor misfortunate banking conduits.
Interesting stats…. I’d be more interested in stats relevant to Australia