I grew up in a society where collective will was at the forefront and it…
US National Accounts – economy plodding along due to fiscal drag
Yesterday (July 31, 2013), the US Bureau of Economic Analysis – published the – US National Income and Product Accounts – for the June-quarter 2013 (the advanced estimates – subject to later revision). The US economy continues to grow but at a fairly sluggish pace. There will no significant incursions into the unemployment rate as a result of this performance. There was a slowdown in the contractionary impact of the fiscal drag coming from the government sector with the federal government’s negative contribution being reduced and a positive contribution to growth from State and local government spending (a rare event these days). There is still a huge output gap in the US (my estimate – around 10 per cent) and no signs of an inflationary surge. Combining that information with the parlous state of the labour market indicates that the US federal government should be increasing their net spending rather significantly at present.
The BEA said in the release that:
Real gross domestic product — the output of goods and services produced by labor and property located in the United States — increased at an annual rate of 1.7 percent in the second quarter of 2013 … In the first quarter, real GDP increased 1.1 percent (revised) … The increase in real GDP in the second quarter primarily reflected positive contributions from personal consumption expenditures (PCE), exports, nonresidential fixed investment, private inventory investment, and residential investment that were partly offset by a negative contribution from federal government spending. Imports, which are a subtraction in the calculation of GDP, increased.
The following sequence of graphs captures the story.
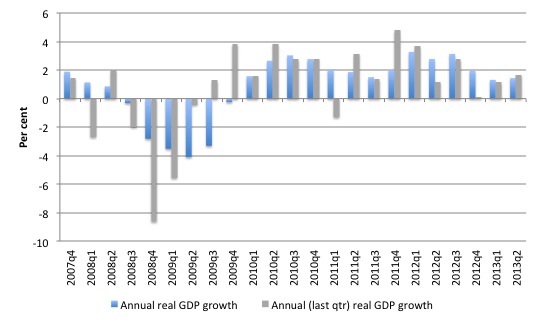
The first graph shows the annual real GDP growth rate (year-to-year) from the peak of the last cycle (December-quarter 2007) to the June-quarter 2013 (blue bars) and the annualised last quarter growth rate (grey bars).
The year-to-year growth rate was only 1.4 per cent, slightly up on 1.3 per cent from last quarter (which was revised downwards from the initial estimate of 1.8 per cent. The trend growth rate is falling. There is considerable volatility in the data which is smoothed out by the year-to-year growth calculation. Overall, the economy is maintaining below-trend growth but is facing contractionary forces.
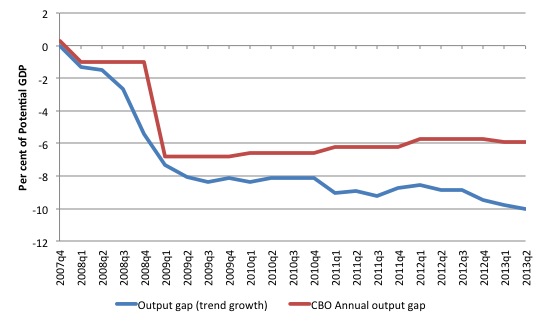
The next graph shows my estimate of the current output gap against the US CBO’s annual estimates (annual is allocated to each quarter within relevant year). If you click it you will see another graph which shows the actual real GDP for the US (in $US billions) and my estimate of the potential GDP. The difference between the two is the output gap (the blue line).
The graph is more accurately called the incremental output gap because I would not presume that there was full employment in the December-quarter 2007.
In other words, my incremental output gap depicts the increase in whatever gap existed at December-quarter 2007.
My estimation method is based on simple extrapolation – starting from the most recent real GDP peak (December-quarter 2007). For a more detailed discussion of how I did this, please read this blog – US problems are cyclical not structural
The projected rate of growth was the average quarterly growth rate between 2001Q4 and 2007Q4, which was a period where real GDP grew steadily (at 0.62 per cent per quarter) with no major shocks. If the global financial crisis had not have occurred it would be reasonable to assume that the economy would have continued to grow at this speed (or thereabouts). Certainly a substantial dip in trend would not have been a reasonable assumption without the crisis.
The current estimated output gap from trend growth is 10 per cent (up from 9.8 per cent in the March-quarter 2013). The CBO has also estimated a rise in the gap in the last two quarters (from 5.7 per cent to 5.9 per cent). Their estimation technique is different to mine and biased towards lower gap estimates. When considering the CBO estimates you have to ask why their output gap estimate rose more or less in line with my estimate during 2008-09 and then levelled out as the economy languished at the new lower levels of growth.
The estimated gap between actual and potential GDP in the June-quarter 2013 is around $US1,742.9 billion (about 10 per cent of potential GDP). I have seen estimates of this around $US1 billion. The truth is somewhere in between these two estimates.
Whatever the actual quantum, the conclusion is that US economy maintains a persistently huge output gap which represents a massive permanent loss of national income every day the gap continues.
This is a cyclical problem. If the gap was due to structural factors then it not have fallen as sharply as it did in early 2008. Structural deterioration is gradual and cumulative not sudden and sharp.
The output gap rose from 8.9 per cent in the June-quarter 2012 to 10 per cent in the June-quarter 2013, indicating that the current growth rate is still relatively weak and provides much more scope for fiscal expansion.
Contributions to growth
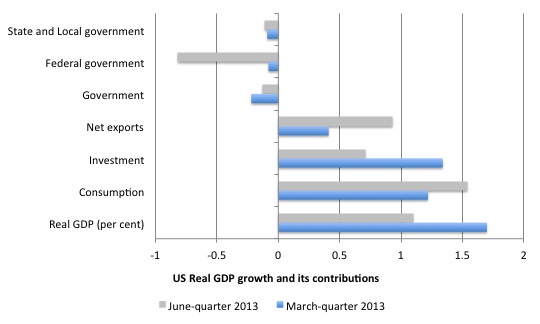
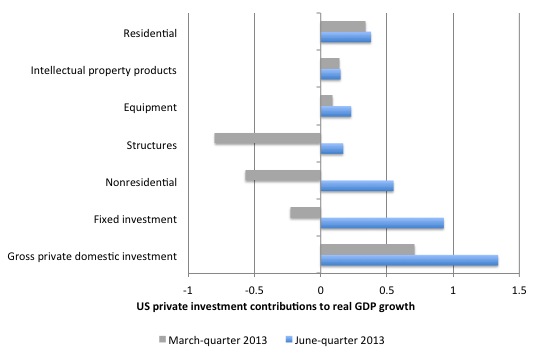
The next graph compares the June-quarter 2012 contributions to real GDP growth at the level of the broad spending aggregate with the previous quarter. The main aggregate source of growth came from Private investment spending, which contributed 1.34 points (up from 0.71) to the overall real GDP growth figure of 1.7 per cent.
Private consumption spending also contributed strongly – 1.22 points – but slowing (down from 1.54 points).
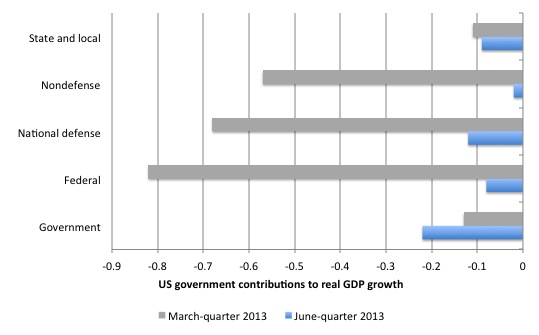
The contraction of the government sector scythed 0.22 points (up from -0.13 points) of real GDP growth in the June-quarter 2013, with the contraction shared between the federal level (-0.08 points) and the state and local level (-0.09 points).
The negative contribution from the federal level has slowed from the first-quarter when it reduced growth by 0.82 points.
Net exports contributed 0.41 points (down from 0.93 points last quarter). Last quarter, it was a case of the contraction in imports being greater than the contraction in exports. In the June-quarter 2013, exports contributed 0.71 points, while imports drained 1.51 points from real GDP growth. That reflects the strengthening of private spending overall.
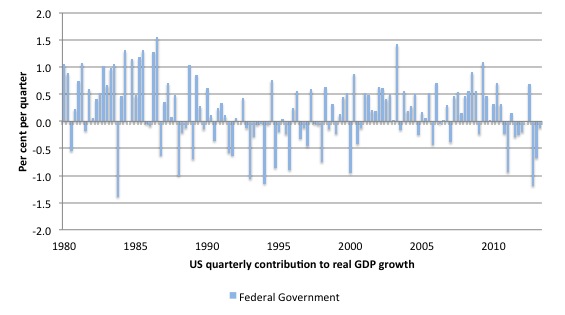
The next graph decomposes the government sector and shows that the contraction in the federal sphere slowed in the June-quarter 2013.
Overall, an expansion is required whatever the composition of spending (defense and non-defense) that they choose.
We noted that private investment spending was the single, largest contributor to growth in the June-quarter 2013 – 1.34 points (up from a downwardly-revised 0.71 points).
Fixed investment added 0.93 points (up from -0.23), non-residential added 0.55 points (up from -0.57), structures added 0.17 points (down from -0.8), equipment and software added 0.23 points (up from 0.09), residential added 0.38 points (up from 0.34), and the change in private inventories added 0.41 points (down from 0.93).
While in the March-quarter 2013, it was largely a big swing in inventories (from -2.0 points to 0.94 points) that drove the total investment contribution, All components of total gross private domestic investment were positive contributors in the June-quarter, which is a better sign.
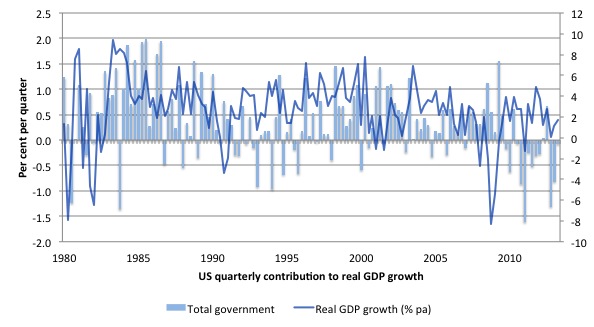
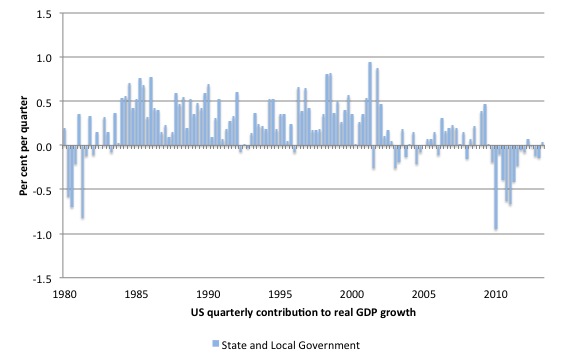
The following sequence of graphs show the contributions to quarterly real GDP growth in the US since the June-quarter 1980 to the June-quarter 2013 by government level (total, federal and state/local in order).
It allows us to see the behaviour of government during the very severe 1982 recession relative to its current behaviour. In the first graph I have superimposed the quarterly percentage real GDP growth (right-axis) to let you see the turning points in the cycle and the recovery aftermath over the course of recent history.
The 1982 downturn began after real GDP growth peaked in July 1981 and it took 16 months to reach the trough in November 1982. There had been an earlier official recession – (see NBER cycle dating) – from January 1980 to July 1980 (a 6-month descent).
The data shows that the US government sector consistently supported growth through the recession (one quarter of contraction) and, importantly, maintained that support in the recovery phase.
That stands in stark contrast to the behaviour of the federal government in the current downturn and recovery.
Since late December 2010, the overall government sector in the US has been undermining real GDP growth. The US government overall started to drag on real growth almost immediately after it had begun. Overall real GDP growth turned positive again in September 2009.
The federal level has been a negative contributor to quarterly real GDP growth for 9 of the last 11 quarters. That should put into some perspective the claims that “we tried aggressive fiscal policy and it didn’t work”.
The correct statement is that the US government injected a stimulus throughout 2008 and maintained it until September 2009 and as a resut growth bounced back from a very deep recession.
After that point it got pressured by conservative forces to cut back and growth started to slow.
The situation is even worse at the State and Local government levels. There was a positive State and local government contribution of 0.04 points in the June-quarter which reversed a long period of negative contributions
Since December 2009, state and local governments together have been negative contributors to real GDP growth in 13 of the 15 quarters, which reflects the imposition of (what I consider to be inappropriate) balanced budget rules and a lack of federal government support for essential services at the state and local level’
If you consider the previous recession periods, both levels of government were running counter-cyclical strategies (contributing positively to growth) in contrast to the present recession.
This is especially so when you consider the State and Local governments. However, in recent quarters it is the Federal government that is draining growth more than its state and local counterparts.
Conclusion
Is the real GDP growth rate fast enough in the US? That depends on what the aim is. In relation to the output gap, the answer is no! In relation to productivity and labour force growth the answer is probably no (although labour productivity growth has slowed a little).
But the current growth rate is below that necessary to make serious inroads into the massive pool of underutilised labour.
The US government is choosing to allow long-term unemployment to continue to rise. There is no fiscal justification for that. They should explain why they consider undermining growth and deliberately maintaining people in a state of unemployment is a sensible option for their nation.
That is enough for today!
(c) Copyright 2013 Bill Mitchell. All Rights Reserved.
I am interested in your opinion on the changes to the way the US calculates GDP numbers and whether the numbers will be a reliable indicator after the changes. Jack Rasmus says that the change could increase GDP by as much as 3%.
I have little doubt Q2 GDP will be revised down, so the situation is likely worse than Dr. Mitchell presents based on the initial figures. Not that his analysis is flawed, he’s just working with the data he’s given.
Ben, where do you expect the revisions to be? Just curious.
I’m understanding everything backwards or the blue lines correspond to 2nd Q and the grey ones to 1st Q?
“Contributions to growth
The next graph compares the June-quarter 2012 contributions to real GDP growth at the level of the broad spending aggregate with the previous quarter. The main aggregate source of growth came from Private investment spending, which contributed 1.34 points (up from 0.71) to the overall real GDP growth figure of 1.7 per cent.
Private consumption spending also contributed strongly – 1.22 points – but slowing (down from 1.54 points).
The contraction of the government sector scythed 0.22 points (up from -0.13 points) of real GDP growth in the June-quarter 2013, with the contraction shared between the federal level (-0.08 points) and the state and local level (-0.09 points).
The negative contribution from the federal level has slowed from the first-quarter when it reduced growth by 0.82 points.
Net exports contributed 0.41 points (down from 0.93 points last quarter). Last quarter, it was a case of the contraction in imports being greater than the contraction in exports. In the June-quarter 2013, exports contributed 0.71 points, while imports drained 1.51 points from real GDP growth. That reflects the strengthening of private spending overall.”