It’s Wednesday and I just finished a ‘Conversation’ with the Economics Society of Australia, where I talked about Modern Monetary Theory (MMT) and its application to current policy issues. Some of the questions were excellent and challenging to answer, which is the best way. You can view an edited version of the discussion below and…
Sectoral balances – Part 1
I am now using Friday’s blog space to provide draft versions of the Modern Monetary Theory textbook that I am writing with my colleague and friend Randy Wray. We expect to complete the text by the end of this year. Comments are always welcome. Remember this is a textbook aimed at undergraduate students and so the writing will be different from my usual blog free-for-all. Note also that the text I post is just the work I am doing by way of the first draft so the material posted will not represent the complete text. Further it will change once the two of us have edited it.
Chapter 6 Sectoral Accounting
In Chapter 5 the national accounting framework was outlined out in some detail. The framework provides a means for measuring the economic activity in an economy over a period of time and allows us to consider the sources of expenditure that drive national income and output. In this chapter we consider economic activity from a different perspective.
To start the discussion, recall the distinction between stocks and flows. In a monetary economy, flows of expenditures measured in terms of dollars spent over a period involve transactions between sectors in the economy, which also have logical stock counterparts. There are two related frameworks that economists use to account for these transactions.
The national accounting framework and the so-called flow-of-funds accounts are two different, but related ways of considering national economic activity.
[NOTE: SOME MORE BACKGROUND HERE TO COME – DETAILING HOW JOINING THESE FRAMEWORKS ALLOWS US TO EXPLICITLY UNDERSTAND THE MONETARY SIDE OF THE ECONOMY]
An early exponent of the flow-of-funds approach, Lawrence Ritter wrote in 1963 that:
The flow of funds is a system of social accounting in which (a) the economy is divided into a number of sectors and (b) a “sources- and-uses-of-funds statement” is constructed for each sector. When all these sector sources-and-uses-of-funds statements are placed side by side, we obtain (c) the flow-of-funds matrix for the economy as a whole. That is the sum and substance of the matter.
[Full reference: Ritter, L.W. (1963) ‘An Exposition of the Structure of the Flow-of-Funds Accounts’, The Journal of Finance, 18(2), May, 219-230]
The flow-of-funds accounts allow us to link a sector’s balance sheet (statements about stocks of financial and real net wealth) to income statements (statements about flows) in a consistent fashion. That is flows feed stocks and the flow-of-funds accounts ensure that all of the monetary transactions are correctly accounted for.
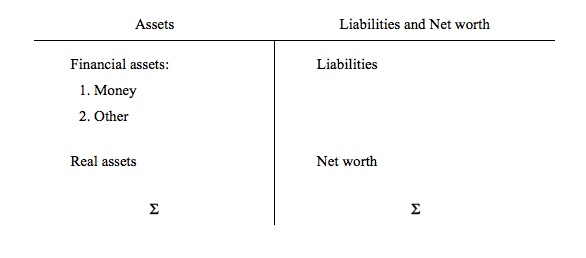
Following Ritter, we can present a very simple “generalised balance sheet”, which would apply to any sector, as being depicted in the following T-account, Figure 6.1
Several points are worth noting. Real assets are treated differently to financial assets because they only appear on the balance sheet of the owner.
Liabilities are different because their existence as debt (to some other sector) means they will be matched by a financial asset on at least one other balance sheet.
Financial assets denote monetary amounts owing to that sector, which by the same logic as before means that there will be a matching liability on at least one other balance sheet within the system.
When we consider the monetary system as a whole, we conclude that financial assets and financial liabilities net to zero – that is, the total value of the financial assets equals the total value of outstanding liabilities.
The accounting also tells us that for the overall economy, net worth equals to monetary value of the real assets in the economy
Figure 6.1 A stylised sectoral balance sheet

The balance sheet depicts stocks but we can easily see how they might provide us with information about flows, in the way the national accounts does. A stock is measured at point in time (say, the end of the year) whereas flows measure monetary transactions over a period (say, a year).
If we examine the difference between a balance sheet compiled at, say December 31, 2011, and a balance sheet compiled at December 31, 2012, we will be able to represent the information in the balance sheet about assets, liabilities and net worth as flow data.
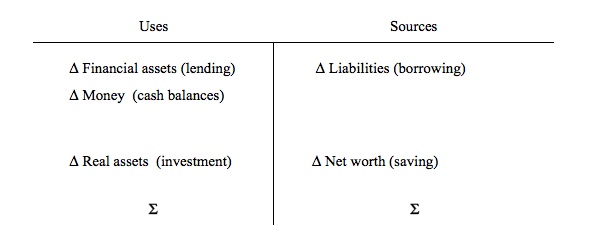
Consider Figure 6.2 (where the Δ symbol refers to changes over the period concerned). Now the entries in the T-account denote uses and sources of funds (that is, flows) over the period of interest. There are two components. One relates to financial assets and the other real assets and net worth.
A given sector (for example, household, firm, government) can obtain funds by increasing their liabilities by borrowing and incurring debt (ΔL). They can apply those funds to accumulating more financial assets (ΔFA) or building cash balances (ΔM)
If we wanted to complicate matters we could decompose – ΔFA, ΔM) and ΔL – further, by recognising that a given sector can also sell existing financial assets or run down cash balances to obtain new funds. Similarly, it might use funds to reduce liabilities (run down debts). So the entries in Figure 6.2 are to be considered net transactions.
Figure 6.2 A uses-and-sources-of-funds statement

The second source and use of funds for a sector relates to changes in Real assets (ΔRA) and the change in Net worth (ΔNW) over a given period.
In the National Accounts framework we considered the division between the Capital Account and the Current Account, where the former related to investment in productive capacity and the latter refered to recurrent spending and income. The Capital Account measured transactions, which change the real assets held and the net worth of the economy.
What do we mean by a change in real assets? In the National Accounts, we considered gross capital formation or investment, which is defined as expenditure on productive capital goods (for example, plant and equipment, factories etc). This is a use of funds by firms in the current period. In Chapter 12, we consider the difference between gross and net investment when we discuss the concept of depreciation. For now though we abstract from that real world complexity.
Finally, we consider the change in net worth for a sector in a given period is the residual after all the uses and sources of funds have been accounted for. From an accounting perspective, net worth is equal to the difference between total assets and total liabilities.
It follows that a change in net worth over the period of interest is equal to the difference between the change in total assets and the change in total liabilities.
If total assets increase by more (decrease by less) than total liabilities increase (decrease) then the net worth of the sector has risen.
Another way of thinking about the change in net worth, which is a flow of funds, is to link it to the National Accounts concept of saving.
In the National Accounts framework, we consider household saving, for example, to be the difference between consumption (a use) and disposable income (a source). This concept generalises (with caution) to the statement that the surplus of a sector is the difference between its current revenue and its current expenditure.
What happens to the flow of surplus funds? If the current flow of income is greater than the current expenditure, then at the end of the period, the sector would have accumulated an increased stock of total net assets – either by increasing the actual assets held and/or reducing liabilities owed.
The surplus between current income and current expenditure has to be matched $-for-$ by an increase in the stock of total net assets. We have already discussed total net assets above but in different terms.
We defined the change in net worth over a period as the difference between the change in total assets and the change in total liabilities. That difference is exactly equal to the surplus between current income and current expenditure.
Thus, from an accounting perspective, we can consider saving to be the change in net worth over a period.
Figure 6.2, however, only implicitly includes the the current account transactions – the flow of current income and expenditure – inasmuch as we have defined the change in net worth (ΔNW) to be the difference between the two current flows.
The simplicity of Figure 6.2, however, makes clear an essential insight – if a sector is running a deficit (that is, it is spending more than it is earning or in the parlance used above, it is investing more than it is saving) then it must obtain the deficit funds from its available sources:
- Increased borrowing
- Running down cash balances
- Selling existing financial assets
Conversely, a sector that it running a surplus (that is, it is spending less than it is earning or in the parlance used above, it is investing less than it is saving) must be using the surplus funds to:
- Repay debt
- Build up cash balances
- Increase its financial assets (increasing lending)
We also have to be cautious in our terminology when considering the different sectors. If we are considering the household sector, then it is clear that if they spend less than their income and thus save they are deferring current consumption in the hope that they will be able to command greater consumption in a future period.
The increase in their net worth provides for increased future consumption for the household.
Similarly, for a business firm, if they are spending less than they are earning, we consider them to be retaining earnings which is a source of funds to the firm in the future.
We consider the private domestic sector as a whole (the sum of the households and firms) to be saving overall, if total investment by firms is less than total saving by households. From the National Accounts, we consider that households save and firms invest.
However, in the case of the government sector such terminology would be misleading. If the government spends less than they take out of the non-government sector in the form of taxation we say they are running a budget surplus. A budget deficit occurs when their spending is greater than their taxation revenue.
But a budget surplus does not increase the capacity of the government to spend in the future, in the same way that a surplus (saving) increases the capacity of a household to spend in the future.
As we saw in Chapter 3, a sovereign, currency-issuing government faces no intrinsic financial constraints, and can, at any time, purchase whatever is for sale in the currency it issues. It capacity to do so is not influenced by its past spending and revenue patterns.
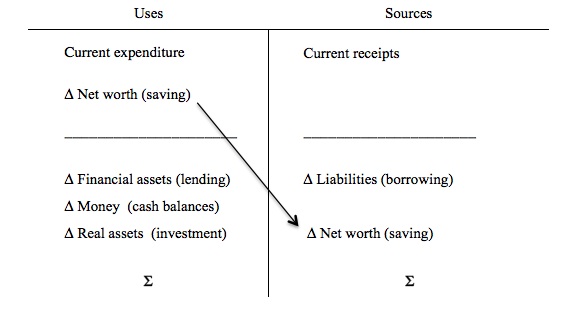
Figure 6.3 provides the most comprehensive framework for analysing the flow-of-funds because it brings together the current transactions (income and expenditure), the financial transactions, and the capital transactions that we have dealt with earlier. The capital and financial transactions are captured in changes to the balance sheet (Figure 6.1)
Figure 6.3 A complete sector uses-and-sources-of-funds statement

The transactions above the dotted line comprise the income statement and record current expenditure (uses) and current revenue (sources). The balancing item above the dotted line is the change in net worth (ΔNW) or “saving”.
The changes in the balance sheet are shown below the dotted line and the balancing item is once again, the change in net worth (ΔNW).
You can see that we could cancel out the change in net worth (ΔNW), which is the balancing item in both the income statement and the change in the balance sheet. This would leave is with the accounting statement that that sources of funds to a sector through current income and borrowing must as a matter of accounting be used – for current expenditures, investment, lending, and/or building up cash balances.
Conclusion
Next week I will complete this chapter by bringing the T-account framework and the NIPA sectoral balances approach together – you can see I have already been doing that today by considering flows as uses and sources.
Then I will introduce more advanced material – suitable for the intermediate macroeconomics students – which will derive a stock-flow consistent framework based on the transactions matrix approach.
Saturday Quiz
The Saturday Quiz will be back again tomorrow. It will be of an appropriate order of difficulty (-:
That is enough for today!
(c) Copyright 2012 Bill Mitchell. All Rights Reserved.
Regarding:
“In the case of the private domestic sector (the sum of the households and firms) to be *saving overall*, if total investment by firms is less than total saving by households.”
Bill, this sentence is *not grammatical*. And even though I have read you for years, not even I can tell exactly what you mean. *So what* if investment by firms is less than saving by households? What’s your point?
Regarding:
“In the case of the private domestic sector (the sum of the households and firms) to be *saving overall*, if total investment by firms is less than total saving by households.”
If you mean
“In order for the private domestic sector to save overall, total investment by firms must be less than total saving by households.”
Why specify just households? Don’t firms save? Didn’t you just say so? So, shouldn’t it be
…saving by households *and firms*?”
The UK ONS has some mildly interesting doc. on capital accounts
entitled
Capital stock, capital consumption and non financial balance sheets, 2003 ,2004 ,2005 etc etc.
The caveats are interesting
These Chronicle the change from a nation state war economy to a extreme market state.
1961 : British telecom & post office reclassified as public corporations
1983 :start of privatisation era (1984 – Uk enters current account deficit ,coincidence ? )
1989 : water and sewage privatised.
1992 : NHS restructured into trusts.
Heres how it works : the UK goes into current account deficit , in particular real goods deficit – the real resourses from these external goods is used to bid up the price of non productive assets such as houses and stuff via credit hyperinflation.
The capital assets of the country appear to increase but the internal productive capacity of the country tanks. (the house price rises are the result of external increases in productive capacity
Eventually after 30~ years of this policey the external resourses from other countries is exhausted , to keep up its “asset” prices it must lay waste to other countries consumption – think Ireland & Spain.
This surplus consumption is directed into UK asset prices ,sustaining the Ponzi for just a bit longer.
It may just may be in the UK & US narrow interest to sustain their monetary policey if you are of a zero sum like game disposition given their extreme real goods trade deficit.
The UK for example has got Germany by the balls as so much excess luxury car capacity flows into the streets of London.
This is game theory played at the highest level possible.
Once banks played nation states off against each other , now its playing market states against each other – at its core it is the same Phenomena
http://www.ons.gov.uk/ons/dcp29904_241335.pdf
refer to 1. : A more detailed stat bulletin
The first graph is very interesting.
Residential buildings & financial assets of households forms the bulk of these assets.
But if you think of these assets as claims on external wealth or productive capacity outside the UK the extreme nature of the UK becomes all too real.
This is why the Q2 net drop in income of £5.5 billion is so important for the UK.
It must destroy Ireland and Spain to sustain real goods coming into the UK but this action also destroys its income.
Its a Catch 22.
We are witnessing the failure of the Anglo model ,the Anglo world.
It has stripped Europe of its wealth…….the jewel of the crown , the eurozone is now a deadzone.
http://www.youtube.com/watch?v=MYnGAZl3pjs
“For Christ sake, John. Don’t be scared. Go on and eat your cookies.”
Dale, I think you might have misquoted what is written above and that the grammar is correct. However, I agree with your other points. Surely firms save or dissave in the same way as households. I would also think that households invest too. For example, if a household buys a house which is going to provide them with a benefit for years to come, that could be considered an investment. It is true, however, that this description does not make a difference to the GDP. The definition of the the GDP is:
GDP = C + I + G + X – M.
If we describe a spending, say an amount A, by the household (or by a firm) as investment instead of consumption, sum C + I in unchanged. There is a increase in the saving equal by the amount A as well as an increase in the investment and a consequent increase in the net worth of the household or firm, but this is an increase in the real wealth, not the financial wealth. When we look at the sectoral balance
S – I = G – T + X – M,
the value of S – I is unchanged. S – I over a period is actually equal to the increase in Net Financial Assets (NFA) so that we could write the sectoral balance equation as
ΔNFA = G – T + X – M.
Dear Tony (at 2012/10/14 at 10:31)
Dale quoted correctly and I appreciated his scrutiny. I fixed the grammar.
In the National Accounts, private dwelling investment caters for home purchases.
But in the more simplistic economic models, we consider households save and firms invest.
best wishes
bill