Most of the economics commentary in the last few weeks about Japan has been about…
A shift to fiscal surplus in Australia would amount to a criminal act by government
The former head of the Australian Treasury claims that: “Everybody knows the budget should be in surplus right now.” Well last time I checked I was still part of the body of humanity and I don’t know that. In fact, the fiscal balance is currently recording a deficit (which should be referred to as a net public injection of financial assets to the non-government sector) which by all indicators is not large enough. The commentators that are blindly repeating the former Treasury head’s assertion really haven’t much idea of how the system works and what the implications of a shift to surplus would have for the overall prosperity of the nation and its people. They blindly rehearse fictions about fiscal deficits pushing up interest rates and leaving future generations worse off. The reality is that if the Federal government could somehow move to surplus, there would be a recession and the number of available workers who were either unemployed or underemployed (currently 10.9 per cent of the available labour force) would rise significantly. That would undermine the well-being of tens of thousands of workers and their families. The call for fiscal surpluses completely ignores the macro linkages that bind the sectors in the economy together. Such a shift would amount to criminal neglect.
When the Treasurer released his most recent fiscal statement (aka erroneously as ‘The Budget’) in May 2026, the former Treasury head was given the platform by the UK Guardian to air his views (May 13, 2026) – Jim Chalmers’ budget doesn’t fix everything – but it’s an overdue first payment to future generations.
He said then that:
At this stage of the economic cycle, the budget should be in surplus. It should not be adding tens of billions of dollars every year to the mountain of public debt.
In that article, the former Treasury head went on to argue that the Australian government should be “underwriting stronger productivity growth … delivering a much better deal for young Australian workers … ” etc.
It also said that the Government should be doing more to “protect and restore the environment” and he finished with this gem:
Australia has spent many decades writing cheques against accounts it does not own, taking from the “natural capital” of future generations and the fiscal resources of people not yet born.
This is a very confusing statement.
‘Natural capital’ is a resource concept and certainly one can argue that the Capitalist system is squandering the ‘natural capital of future generations’ because it is creating a climate catastrophe as a result of its largely unfettered resource depletion.
The “fiscal resources of people not yet born” is an entirely different concept.
For a currency-issuing nation such as Australia, those resources are identical to those available to the current generation, or past generations, for that matter.
The Australian government’s spending capacity is infinity minus a cent (given that infinity is not defined as a standard real number and currency is).
The current generation via the voting system effectively ‘chooses’ the fiscal parameters.
If a government defies that choice then they lose office.
The next generation have the same choice – they can choose whatever tax burden they take on.
However, the fiscal parameters influence the evolution of the private financial balances for reasons I will explain next.
That distinction goes to the heart of the matter I am discussing today.
In – ‘Budget Paper No.1’, Statement 2: Economic Outlook and Statement 3: Fiscal Strategy and Outlook – that were released by the Australian Treasury in May 2026, we observed the following forecasts.
| Aggregate | 2024-25 (Actual) | 2025-26 | 2026-27 | 2027-28 |
| Current Account (% of GDP) | -2.5 | -1.8 | -2.75 | -4.00 |
| Fiscal balance (% of GDP) | -0.4 | -1.0 | -1.0 | -1.0 |
The forecasts also suggest that the fiscal balance will be -1.0 per cent of GDP in 2028-29 and -0.4 per cent of GDP in 2029-30.
Silent from the Treasury’s discussion was what these forecasts implied for the private domestic sector’s financial balances – that is, the implied change in non-government indebtedness.
Before I consider the implications, there was an Op Ed from the Melbourne Age’s Political and international editor over the weekend (August 1, 2026) – One bold, fiscal move would ease our economic anxiety. Does the PM have the nerve? – which chose to mimic the former Treasury head’s claim about what everybody thinks.
The tenet is that federal government “cost of living support” measures are :
… voodoo. They do nothing to change the pressures building inside the volcano. Worse, we know that the cost of these trinkets goes directly onto the national debt. And that only fuels the problem further.
Any fiscal support to lower income families in cash support or reductions in prices for essentials is hardly ‘nothing’.
Maybe the journalist’s salary is sufficient to insulate him from the pressures that the supply-side inflationary forces have created on household budgets.
Notice I use the term ‘household budget’ but eschew any use of the terminology ‘budget’ when discussing the fiscal situation of a currency issuing national government.
Household spending is financially constrained.
Government spending is not.
That is a huge difference.
The journalist then decided to seek authority from the former Treasury boss:
The government has an opportunity to grab this problem by the throat by putting the budget on a more sustainable trajectory that would provide insurance against future volatility … Everybody knows the budget should be in surplus right now … It’s not, of course. It’s exactly the opposite.
And thanks that is “exactly the opposite”.
The most recent labour force data revealed that the unemployment rate was 4.4 per cent.
In June 2026, underemployment rose 0.2 points to 6.5 per cent (rising 35.8 thousand to 1009.6 thousand).
The Broad Labour Underutilisation rate (the sum of unemployment and underemployment) rose 0.2 points to 10.9 per cent.
Overall, there are 1,696.4 thousand people either unemployed or underemployed.
When considering the ‘this stage of the economic cycle’ (with reference to the opening quote from the former Treasury head) that data tells me there is massive excess resource capacity in the Australian economy.
Nearly 11 per cent of available and willing labour resources are idle in one way or another.
That tells me that given the spending and saving decisions taken by the non-government sector, the government’s net financial position is too restrictive.
Given that that position is a deficit of around 1 per cent of GDP, that conclusion means that the fiscal deficit should move further into deficit to fill the spending gap left by the non-government sector’s spending decisions.
Looking back at the first Table, we see that the expenditure drain from the external sector is predicted to increase rather substantially over the forecast period as the predicted terms of trade decline significantly.
When the current account is in deficit, the currency flows into the country are less than the flows that leave the country.
Export flows add spending demand and increase national income, while import flows see income generated in the local economy lost in expenditure on foreign goods and services.
An external deficit then means there is a net outflow of spending from the nation.
Ally that with the knowledge that the fiscal deficit is forecast to decline from 1 per cent of GDP to 0.7 per cent over the course of the forward estimates.
So there are contractionary forces on domestic spending coming from the external sector and the move from a fiscal position of 1 per cent of GDP deficit to a 0.4 per cent deficit position.
Taken together it means that private domestic demand will have to do the lifting and that suggests rising indebtedness.
We know that the financial balance between spending and income for the private domestic sector (S – I) equals the sum of the government financial balance (G – T) plus the current account balance (CAB).
The sectoral balances equation is:
(1) (S – I) = (G – T) + CAB
which is interpreted as meaning that government sector deficits (G – T > 0) and current account surpluses (CAD > 0) generate national income and net financial assets for the private domestic sector to net save overall (S – I > 0).
Conversely, government surpluses (G – T < 0) and current account deficits (CAD < 0) reduce national income and undermine the capacity of the private domestic sector to accumulate financial assets.
Expression (1) can also be written as:
(2) [(S – I) – CAB] = (G – T)
where the term on the left-hand side [(S – I) – CAB] is the non-government sector financial balance and is of equal and opposite sign to the government financial balance.
This is the familiar Modern Monetary Theory (MMT) statement that a government sector deficit (surplus) is equal dollar-for-dollar to the non-government sector surplus (deficit).
The sectoral balances equation says that total private savings (S) minus private investment (I) has to equal the public deficit (spending, G minus taxes, T) plus net exports (exports (X) minus imports (M)) plus net income transfers.
All these relationships (equations) hold as a matter of accounting.
That accounting is created by the way national income changes impact on the various aggregate flows in Equation 1 above.
So the behavioural parameters for the aggregate flows are:
S – household saving – varies positively within GDP (income).
I – private capital formation – – varies positively within GDP (income).
G – government spending – varies inversely with national income because welfare spending falls in a stronger economy.
T – government tax revenue – varies positively with GDP – more people working, more tax revenue and vice versa.
M – imports (one part of the external balance) – varies positively within GDP (income) – we buy more of everything when our incomes rise.
So when, for example, the government cuts back on spending relative to taxation (G – T declines in size), which means total expenditure declines, unemployment rises, households earn less, and all those flows change in predictable directions until the accounting balance is restored at a lower level of economic activity.
The accounting statement really shows how the three sectors are intrinsically interlinked.
If one sector changes its spending behaviour then the consequences will reverberate through to the other sectors via the linkages shown above.
What that means is that making simple statements like:
“the budget should be in surplus”
This cannot be understood without reference to what a fiscal surplus would mean for the other balances – external and private domestic.
The private domestic balance, in particular, tells us, among other things, what the direction of private indebtedness will be.
So if the private balance is in deficit – meaning the households and firms, collectively, are spending more than their income, then over time, that means that indebtedness must be rising, given that the private sector faces a financial constraint.
Here is why that simple statement is ridiculous.
In its May 2026 fiscal statement, The Government estimated that the negative global factors will continue to undermine Australia’s terms of trade.
By 2027-28, they forecast a decline of 7.25 per cent in our terms of trade
Australia is forecast to return to its usual position of an external deficit of 4 per cent of GDP – a state that has been dominant since the 1970s.
That means that net income is leaving the nation to the rest of the world.
Remember for the level of economic activity to remain unchanged total expenditure must equal total output produced.
Expenditure is driven by income produced.
If some of the income produced by the economy is flowing out (via imports) and export revenue coming in is less than that flow, then there is an income drain from the economy.
At least one other source of expenditure (government, household consumption, and/or private investment) must fill that gap or total output will decline.
The following graph tells the story.
It shows the sectoral balance aggregates in Australia for the fiscal years 2000-01 to 2028-29, with the forward years using the Treasury projections published in ‘Budget Paper No.1’ which are the observations to the right of the thick black line.
Disregard the dotted lines for a moment.
The projections begin in 2026-27 and I have assumed that 2028-29 outcome will be equal to the 2027-28 Government estimate.
All the aggregates are expressed in terms of the balance as a percent of GDP.
I have modelled the fiscal deficit as a negative number even though it amounts to a positive injection to the economy.
You also get to see the mirror image relationship between it and the private balance more clearly this way.
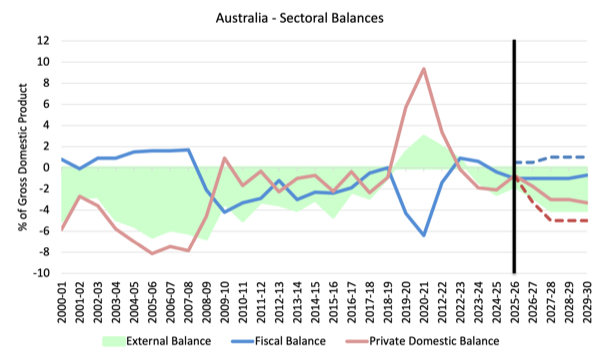
It becomes clear, that with the current account deficit (green area) projected to return increasing deficits, which drain net spending from the domestic economy and with the fiscal balance moving towards zero over the same period, the private domestic balance (red line) will head quickly into higher deficits.
Higher private domestic deficits mean higher levels of indebtedness.
The Household sector is already carrying record levels of indebtedness which is why household consumption expenditure has been slowing down appreciably in the face of rising cost-of-living pressures.
You can see that the pandemic support from Government clearly allowed the private domestic sector to rebuild its saving buffers and reduce the precarity of its balance sheet (given the massive household debt).
In the earlier period, prior to the GFC, the credit binge in the private domestic sector was the only reason the government was able to record fiscal surpluses and still enjoy real GDP growth.
But the household sector, in particular, accumulated record levels of (unsustainable) debt (that household saving ratio went negative in this period even though historically it has been somewhere between 10 and 15 per cent of disposable income).
The fiscal stimulus in 2008-09 saw the fiscal balance go back to where it should be – in deficit – given the nation’s external deficit position.
This not only supported growth but also allowed the private domestic sector to start the process of rebalancing its precarious debt position.
You can see the red line moves into surplus or close to it.
That process was interrupted by the renewal of the fiscal surplus obsession in 2012-13.
The strong fiscal support during the pandemic overwhelmed all the nonsensical deficit scaremongering and allowed the private domestic sector to increase its overall saving (and pay down debt) which was a good thing.
But as the previous government withdrew its stimulus – and shifted towards and into fiscal surplus, the liquidity squeeze on the private domestic sector (because G < T) was temporarily staved off by the external surplus.
But once the external sector moved back into its usual deficit position, the squeeze on the private domestic sector intensified until the latest disruptions (Iran etc) saw some fiscal easing.
You can see that if the government’s austerity plans are realised and the fiscal position moves more close to balance (blue line) the private domestic deficit increases, which means that sector is going to be forced to accumulate more debt to maintain its spending.
With a global recession threatening and with higher interest rates the norm, the strategy outlined in the Government’s fiscal statement is once again placing the economy on an unsustainable path relying on household debt accumulation, which is a finite process.
Now think about what “the budget should be in surplus” would imply – that is indicated by the dotted lines.
For illustrative purposes, I assume the 0.5 per cent of GDP surplus this year (2025-26), repeated in 2026-27, then rising to 1 per cent in the years 2027-28, 2028-29, and 2029-30.
That is probably conservative relative to what these commentators are calling for.
If that was the case, and the external position was as forecast, then the private domestic sector would be forced into a higher deficit and higher indebtedness – an even more unsustainable position.
The other reality is that unemployment would be even higher if the government moved towards a balance.
The second cited article that came out over the weekend, claims:
So the logic runs that, by cutting the deficit, the government would be cutting demand in the economy, easing inflation, easing the debt burden and lowering interest rates too.
What’s not to like about this? If you’re the government, plenty. The hard implication is that the federal government can ease inflation by cutting spending. And the government, like all governments, loves spending. It’s why they fight so hard to win the treasury benches. To spend the treasure. And the people and industries which would lose funding or pay more tax would be guaranteed to scream.
This is an extraordinarily ignorant statement.
What’s not to like about this?
The recession which would destroy the prosperity of households who would become unemployed.
The children of the jobless households who inherit the disadvantage and take it into their adult lives.
The households who lose their houses because they can no longer pay the mortgage.
The public services that are compromised by the austerity.
The drop in productivity because the austerity harms infrastructure development and undermines the education sector.
Do I need to continue?
And as I indicated in my blog post last week – RBA governor makes another self-serving public presentation ignoring the dismal reality she is helping to create (July 30, 2026) – the idea that the current inflationary pressures are an excess demand outcome is the fiction the RBA is pushing but doesn’t reflect the underlying forces involved.
There is no justification for the recent interest rate hikes.
So trying to use that as a justification for imposing more austerity on a nation that has 10.9 per cent of its willing and available labour resources doing nothing amounts to criminal neglect.
Conclusion
It is really tough reading this stuff and realising that the commentators who are lucky enough to have the national platform really don’t know much about the way the system operates.
That is enough for today!
(c) Copyright 2026 William Mitchell. All Rights Reserved.

“There is no justification for the recent interest rate hikes.”
Absolutely none!
It would only make sense to raise interest rates if we want everyone to save more. If they save more, by buying up govt bonds etc, this equates to the government having a higher debt which is just the opposite of what we are told we need to avoid!
It’s not that hard to understand. Yet, and as Bill says, “the commentators who are lucky enough to have the national platform really don’t know much about the way the system operates”.
Amazing!
Professor Mitchell, the situation is the same in Japan. When so-called experts and commentators start advocating for a balanced budget—acting as if it were a matter of course—I get so furious I feel like smashing my TV. So far, I’ve managed not to, since the TV itself isn’t actually playing a prank on me.
Sorry, Just realised that my comment should read
“…..just what we are told we need to avoid”
But, Peter (Peter Martin), the non-govt sector can only save more if everyone’s desire to save more of every dollar they earn (I.e., spend less of every dollar they earn) is accommodated by the currency-issuing central government by way of increased G or decreased T, or a bit of both.
Surely you’ve heard of the paradox of thrift? When everyone saves more of every dollar they earn, there is less aggregate spending (lower GDP) and therefore less income from which the non-govt sector can save. Everyone saves more of every dollar earned, but fewer dollars are earned. If G = T and remains that way, total saving by the non-govt sector remains the same.
Since T is a function of GDP, when everyone tries to save more and GDP falls, T falls. Thus, G usually exceeds T, but never enough to fully accommodate the increased desire of the non-govt sector to save. Worse still, because GDP falls (assuming employment is positively correlated to movements in GDP), unemployment rises. It’s the usual cause of a GDP recession, where the increased desire to save is often forced upon the non-govt sector following prolonged reductions in G in an attempt by the central govt to run what is customarily referred to as a budget surplus. In other words, it’s a recipe for disaster, as Bill has highlighted in his blog piece.
The non-govt sector balance should be left to the desires of the non-govt sector. The CICG’s balance should float to accommodate the non-govt sector’s wishes. If the non-govt sector balance is always S > I, as per its wishes, then assuming X = M, it is necessary for the CICG’s balance to be G > T, which it can be forever. The non-govt sector usually likes to net save (S > I). Long periods of S < I are usually caused by inadequate G, which induces the non-govt sector to borrow up big (large I) to maintain its spending desires, having been forced by the inadequate G (and reduced GDP) to abandon its savings desires (i.e., not enough GDP to accommodate the non-gov sector's spending AND savings desires). It's when the non-govt sector builds up large unserviceable debts that it is forced to abandon its spending desires and revert to saving to pay off its debts. The switch in desires triggers a GDP recession (a.k.a. 2007-2008 GFC). The GFC was not 'caused' by the US sub-prime mortgage crisis. The sub-prime crisis was merely one of the straws that broke the camel's back.
CofFEE (Bill’s research centre) used to hold an ‘unemployment’ conference each year. I would attend it as often as I could. Around about 2004, I arrived a day early and went out to see Bill and say hello. Warren Mosler and Randy Wray had arrived a day or two earlier than me. When I entered Bill’s workspace, there was Bill, Warren, and Randy sitting around Bill’s computer screen. On the screen was a graph of private sector debt, which had been building up for a number of years. They all agreed that a GDP recession was around the corner.
I think the next conference I attended was in 2006. The GDP recession had not eventuated (the timing of such events is difficult to predict). Bill, Warren, and Randy were still predicting a recession except this time, with larger private sector debt, with more dire consequences. Meanwhile, Australia’s Treasurer, Peter Costello, was beating his chest because the Australian Federal Government had just recorded another budget surplus (non-govt sector deficit). Little did Costello know that his govt was setting Australia up for a mighty crash. Similar things were happening throughout the world.
Sure enough, the recession hit in 2007-2008 and economies around the world fell off a cliff as Bill, Warren, and Randy had predicted.
Poor Australians – looks like the only time since the GFC that they had any net savings at all was during the worst of Covid.
What does that say about an economy?
MrShigemitsu: In fact, the surplus-obsessed Fed Govt at the time lost the 2007 election and the incoming govt went on a spending spree. Many people were posted $900 cheques and a lot of useless stuff was produced, such as unwanted new halls for schools.
Despite a lot of people using the $900 cheques to pay off debt, the increased G helped Australia avoid the worst of the GFC. Unemployment rose, but nothing like it did in many countries. Of course, if a Job Guarentee had been in place, unemployment would not have risen at all, and perhaps the non-govt sector wouldn’t have accumulated such large debts in the first place. So, Australia has experienced an increase in non-govt savings since the onset of the GFC other than from COVID-related govt spending.
“the commentators who are lucky enough to have the national platform really don’t know much about the way the system operates”.
And that is the way it’s meant to be.
Which is why Bill is such a ‘god’send.
Thanks Bill.
@ Philip,
It’s dangerous to use the sectoral balances to try to show causality. Do Govt deficits rise because they spend more and/or reduce tax rates or because the other sectors choose to save more? Or, can we say that increasing Govt spending /reducing tax rates will induce people to save more? Businesses are more likely to borrow more to take advantage of an expanding economy.
The history of changing interest rates does, though, generally show that saving is higher and borrowing is lower when rates are increased. Conversely when they are lowered we see the opposite. House prices rise faster when interest rates are lowered.
And ironically saved Costello’s “legacy”, a string of much applauded fiscal surpluses.
Labor’s spend smothered the ‘all-but-inevitable’ Costello trainwreck.
John Armour: it would have been interesting had the Coalition won the 2007 election. I doubt whether the Coalition would have net-spent to the extent that the Labor Government did. And, of course, Labor was blamed for the GDP recession in Australia and for the large deficits that ensued. Not that the Coalition would have been running surpluses once the non-govt sector abandoned its spending desires (and stopped borrowing) and began saving, when it could, to pay off its debts.
Peter Martin: While you are right regarding certainty of causality, by and large, the CICG’s budget bottom line (if one wants to call it that) is driven by the spending and net-savings desires of the non-govt sector. If a CICG cuts G in an attempt to operate a budget ‘surplus’, it can influence the spending and net-saving behaviour of the non-govt sector because the decline in GDP caused by the reduction in G prevents the non-govt sector from achieving both its spending and net-saving objectives. It is forced to abandon one of the two objectives to attain the other objective.
Behavioural economists (e.g., Daniel Kahnamen) have shown that most people despise losses of a particular value much more than they like gains of the same value. Hence, when a cut in G results in a cut in the income of the non-govt sector, the sector invariably abandons it net-saving goals to maintain consumption expenditure (maintain spending goals). It does this by borrowing and it allows the CICG to achieve its budget surplus objective. The increased borrowing by the non-govt sector fills some of the gap caused by the decline in G, which in turn keeps GDP buoyant and T high. Finance ministers beat their chest not only for achieving a budget surplus, but doing it without it affecting GDP and therefore unemployment.
Of course, it is a temporary phenomenon because the increase in non-govt sector borrowing is unsustainable, unlike an increase in G. Eventually the non-govt sector is forced to switch to achieving its net-saving goals to pay off its debts and abandon its spending goals. That’s when the spending of the non-govt sector collapses, GDP crashes, unemployment rises, and the CICG runs a budget deficit whether it likes it or not. That’s the typical storyline of every GDP recession.
Peter Martin: Exceptions to the typical storyline are severe supply side shocks, such as oil price hikes and pandemics which expose the structural weaknesses and deficiencies of economic systems.
@ Philip,
“the CICG’s budget bottom line (if one wants to call it that) is driven by the spending and net-savings desires of the non-govt sector”
I’d prefer to call it the Govt’s net balance which is given by
(G-T) = (S-I) + (M-X)
Where G,T, S etc are as usually defined for the sectoral balance equation.
The two terms on the RHS of the equation can be understood as “the {net} savings desires of the non government sector.” Just how they depend on G is debatable – especially in respect of the overseas sector’s (M-X)
The point you are making, if I understand you correctly, is that the Govt’s net balance (G-T) isn’t entirely of its own choosing except perhaps in the very short term. It can only run a deficit (or surplus) if others want to run surplus (or deficit).
Peter Martin: if the non-govt sector is stubbornly determined to meet its net-savings desires and adjusts its discretionary spending as changes in G affect GDP, the CICG has virtually no control over its budget bottom line.
Failure to understand this (e.g., Federal Treasury Dept in Australia) results in the laughable situation where the Australian Treasurer occasionally presents a graph at a press conference predicting the Fed Govt’s budget bottom line (balance) for the next five or so years as if the CICG has control over it.
It is possible for the non-govt’s net-saving desires to be accommodated, should the CICG not do it, by net-exporting (X > M). However, a nation can’t simply net-export at will. Even if it is successful, it is a very costly way to accommodate the non-govt sector’s net-saving desires. It means using some of the nation’s real resources that could have been purchased by the CICG and directed to build schools and hospitals to instead produce goods desired and enjoyed by foreigners. A case of increasing a nation’s export costs (note: exports are costs and imports are benefits) to meet the non-govt sector’s net-saving desires.
Best to operate as (G > T) = (S > I) – (X = M), which is financially sustainable and strengthens the non-govt sector’s balance sheets.
Not as (G < T) = (S < I) – (X = M), which is financially unsustainable.
Or as (G I) – (X >> M), which is very costly.
Best to operate as Best to operate as (G > T) = (S > I) – (X = M)
Maybe. But making S>I is in the direct control of the Domestic Private Sector. However, Govt can influence, but no more than influence, the net saving of the private sector by adjusting interest rates. The foreign sector is in control of X and M too if the exchange rate is allowed to freely float. Changing interest rates can also influence (M-X) which can be understood as the net savings of the foreign sector.
Bill might disagree with me on this but higher interest rates encourage (but again no more than that) the foreign sector to feed back their surplus ££ into the economy by buying bonds and other UK investments. This will push up the exchange rate which enables UK buyers to afford more imported goods and services. UK exports become less competitive.
Whether or not this is a good thing is a matter of some debate.
Peter Martin: Regardless of what might or might not encourage private sector saving, an increasing desire of the non-govt sector to net-save has to be accommodated by either the govt sector or the external sector, or by a bit of both. The non-govt sector cannot create net financial assets. Without accommodation by the govt and/or external sectors, any attempt by the domestic non-govt sector to increase its net financial assets (I.e., by saving a larger share of every after-tax dollar earned) is futile.
Worse still, if it results in the domestic non-govt sector spending a smaller share of every after-tax dollar earned, GDP declines (total ater-tax income falls) and unemployment rises. It’s simple sectoral balances stuff.
Strangely, you learn about sectoral balances when you study economics (it’s the basis of the IS curve, which should be called an injections = leakages curve because every point on such a curve represents interest rate and GDP combinations where financial injections equal financial leakages) but there is little talk about the dynamics of sectoral balances. The exception is the paradox of thrift, which is assumed to occur if the non-govt sector attempts to increase its net-savings. You aren’t taught that an institutional mechanism that automatically increases G to fill the spending gap when the non-govt sector attempts to save more (spend less), such as a Job Guarentee, would avert the paradox of thrift by accommodating the non-govt sector’s desire to increase its net-savings. You are not taught this because it would reveal that a CICG can always create the money needed to put to work any resources rendered idle by an increase in the non-govt sector’s desire to save more/spend less.
I might add that financial injections are I + G + X and financial leakages are S + T + M. All spending on new domestically-produced goods and services begins with a financial injection. Eventually, a financial injection leaks entirely from the system since financial injections must equal financial leakages. It is the rearrangement of (I + G + X) = (S + T + M) to obtain (G – T) = (S – I) – (X – M) that yields the sectoral balances equation.
It is clear that for S to rise to meet an increased desire of the non-govt sector to save (decreased desire to spend the same share of every after-tax dollar earned), one or more of I, G, and X must rise. If it is due to an increase in I, which is really a measure of non-govt sector spending on new goods and services financed by the borrowing of credit money, then the savings (deposits) generated are what I call ‘soft’ savings because they are temporary. They are destroyed as the principal on the advanced credit money is repaid. And while S may have increased due to the increase in I, there is no increase in the net-savings (net financial assets) of the non-govt sector.
If the increase in S is due to an increase in G and X, there is a permanent increase in savings (unless later destroyed by taxation or later spent in imports) or what I call ‘hard’ savings. If S = I, all savings are soft savings. Only S > I constitutes hard savings (I.e., an increase in the net-savings or net financial assets of the non-govt sector).
Also, if G or X rises to accommodate the non-govt sector’s desire to increase its net-savings, it must increase by more than the desired increase in S. The reason for this is that a financial injection does not immediately leak from the system. The increased spending is received by the seller of goods and services as income. Some of the income is taxed (increase on T). Some of the after-tax income is saved (increase in S). Some of the remainder, which is respent on new goods and services, is spent on imported goods (increase in M). Hence, all three leakages rise following an increased financial injection. The respent income becomes another round of income of which some is taxed, saved, and spent on imports. Again, some portion of the respent income will be respent. Each round of repsent income gets smaller until the the value of the initial financial injection has entirely leaked from the system as S, T, and M. Clearly, S will not have gone up as much as the increased financial injection. Thus, a specific increase in S requires an even larger increased financial injection. This entire process is referred to as the expenditure multiplier process, where GDP increases more than the increase in the financial injection. Bill explains this process well in the ‘Macroeconomics’ textbook he co-wrote with Randy Wray and Martin Watts.