The editorial in The Japan Times (July 3, 2026) - Little hope for a declining…
Australia – inflation rate slightly up but stripping out volatility shows significant declines
Today (July 31, 2024), the Australian Bureau of Statistics (ABS) released the latest – Consumer Price Index, Australia – for the June-quarter 2024. The data showed that the annual inflation rate continues rose by 0.2 points to 3.8 per cent but was steady over the quarter. The major factors driving the inflation at present are housing (rents) and food prices, the latter due to abnormal weather events. The major expectations series all show expected inflation to be in decline and well within the RBA’s target zone. Further, when we strip out the volatile components (like weather) the preferred series (Trimmed Mean and Median) are all declining. There is now no case at all for further rate hikes.
The summary, seasonally-adjusted Consumer Price Index results for the June-quarter 2024 are as follows:
- The All Groups CPI rose by 1.0 per cent for the quarter (steady) and 3.8 per cent over the 12 months (up from 3.6)
- The Trimmed mean series rose by 0.8 per cent for the quarter (down from 1) and 3.9 per cent over the previous year (down from 4 per cent).
- The Weighted median series rose by 0.8 per cent (down from 1.1 per cent for the quarter and 4.1 per cent over the previous year (down from 4.4 per cent).
The ABS Media Release (July 31, 2024) – CPI rose 1.0% in the June 2024 quarter – noted that:
The Consumer Price Index (CPI) rose 1.0 per cent in the June 2024 quarter and 3.8 per cent annually …
The annual rise of 3.8 per cent for the June quarter is up from 3.6 per cent in the March quarter. This is the first increase in annual CPI inflation since the December 2022 quarter …
The most significant contributors to the June quarter rise were Housing (+1.1 per cent) and Food and non-alcoholic beverages (+1.2 per cent).
The quarterly growth in Housing was driven by Rents (+2.0 per cent) and New dwellings purchased by owner-occupiers (+1.1 per cent). …
Fruit and vegetable prices rose this quarter as unfavourable growing conditions drove higher prices for grapes, strawberries, blueberries, tomatoes and capsicums. This was the highest quarterly rise for Fruit and vegetables since 2016 …
Underlying inflation measures reduce the impact of irregular or temporary price changes in the CPI. Annual trimmed mean inflation was 3.9 per cent, down from 4.0 per cent in the March quarter …
This is the sixth quarter in a row of lower annual trimmed mean inflation, down from the peak of 6.8 per cent in the December 2022 quarter …
So a few observations:
1. The annual inflation rate rose slightly on the back on on-going rental inflation and food price rises, the latter driven by abnormal seasonal weather factors.
2. The Housing inflation from New dwelling purchases was steady but the rental component remains significant, albeit now in decline.
3. The rent inflation is due to tight supply (a combination of a ridiculously fast population growth spawned by much larger immigration numbers over the last year) and a failure by governments to invest in social housing over the last several decades.
5. However, given the tight supply, the rent increases are being driven by the RBA’s own rate hikes as landlords in a tight housing market just pass on the higher borrowing costs – so the so-called inflation-fighting rate hikes are now a significant force in driving inflation.
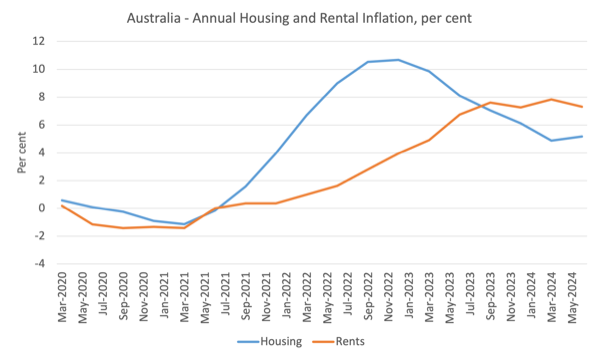
This graph shows that housing inflation peaked in the December-quarter 2022 and has been steadily declining ever since.
However, the rental sub-component has been rising more or less since the RBA started hiking rates and is now the major reason the housing inflation rate is still around 5 per cent per annum.
Trends in inflation
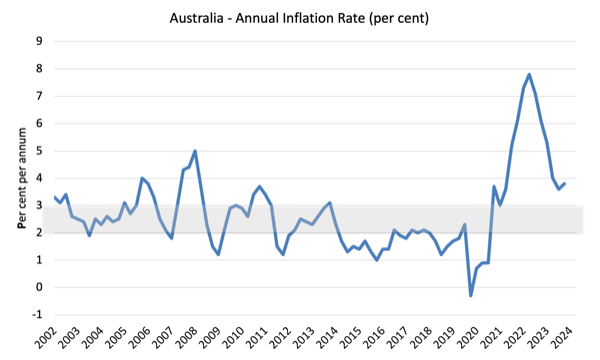
Over the 12 months to December the inflation rate was 3.8 per cent (up from 3.6).
The peak was in the December-quarter 2022 when the inflation rate high 7.8 per cent.
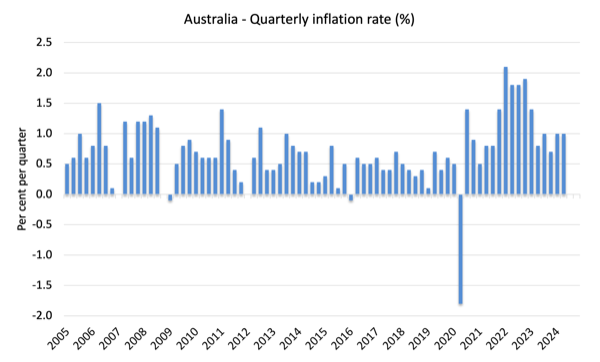
The following graph shows the quarterly inflation rate since the June-quarter 2005.
The next graph shows the annual headline inflation rate since the first-quarter 2002. The shaded area is the RBA’s so-called targetting range (but read below for an interpretation).
What is driving inflation in Australia?
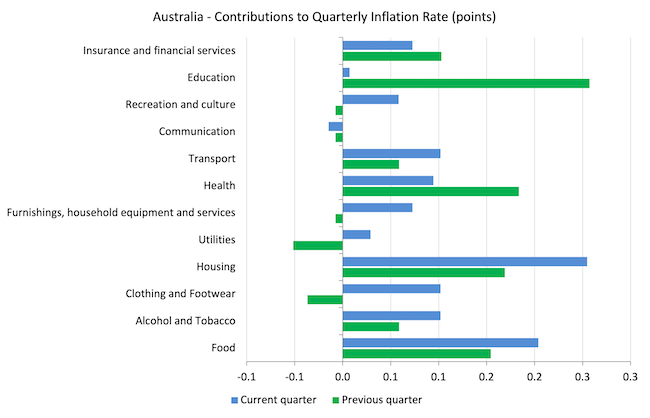
The following bar chart compares the contributions to the quarterly change in the CPI for the June-quarter 2024 (blue bars) compared to the December-quarter 2023 (green bars).
Note that Utilities is a sub-group of Housing and are significantly impacted by government administrative decisions, which allow the privatised companies to push up prices each year, usually well in excess of CPI movements.
One of the main drivers – Housing – arises from the supply shortage where the years of neglect by governments in supplying adequate housing for low-income families is now coming home to roost.
Food was also a significant factor this quarter due to some abnormal weather patterns, which are clearly not due to excess spending.
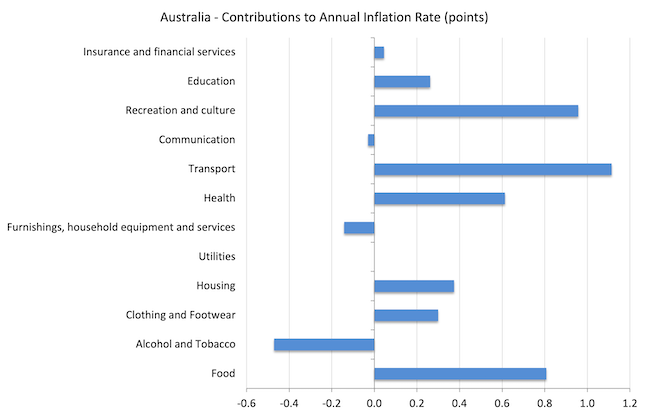
The next graph shows the contributions in points to the annual inflation rate by the various components.
Inflation and Expected Inflation
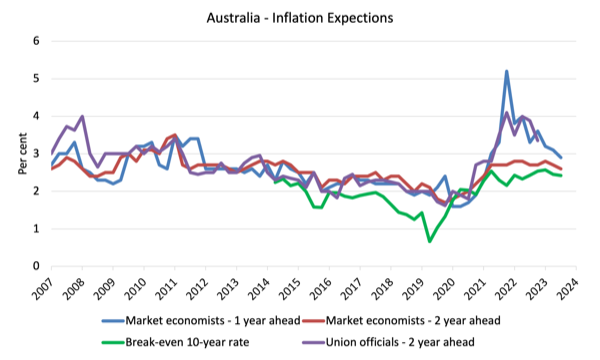
The following graph shows four measures of expected inflation produced by the RBA from the June-quarter 2005 to the June-quarter 2023.
The four measures are:
1. Market economists’ inflation expectations – 1-year ahead.
2. Market economists’ inflation expectations – 2-year ahead – so what they think inflation will be in 2 years time.
3. Break-even 10-year inflation rate – The average annual inflation rate implied by the difference between 10-year nominal bond yield and 10-year inflation indexed bond yield. This is a measure of the market sentiment to inflation risk. This is considered the most reliable indicator.
4. Union officials’ inflation expectations – 2-year ahead – this series hasn’t been updated since the September-quarter 2023.
Notwithstanding the systematic errors in the forecasts, the price expectations (as measured by these series) are now falling.
In the case of the Market economists’ inflation expectations and the Break-even 10-year inflation rate, the expectations remain well within the RBA’s inflation targetting range (2-3 per cent) and are declining.
So all the talk now is that inflation is not falling fast enough – and that claim is accompanied by claims that the longer it remains above the inflation targetting range, the more likely it is that a wage-price spiral and/or accelerating (unanchored) expectations will drive the rate up for longer.
Neither claim can be remotely justified given the data.
Implications for monetary policy
What does this all mean for monetary policy?
The Consumer Price Index (CPI) is designed to reflect a broad basket of goods and services (the ‘regimen’) which are representative of the cost of living. You can learn more about the CPI regimen HERE.
The RBA’s formal inflation targeting rule aims to keep annual inflation rate (measured by the consumer price index) between 2 and 3 per cent over the medium term.
However, the RBA uses a range of measures to ascertain whether they believe there are persistent inflation threats.
Please read my blog post – Australian inflation trending down – lower oil prices and subdued economy – for a detailed discussion about the use of the headline rate of inflation and other analytical inflation measures.
The RBA does not rely on the ‘headline’ inflation rate. Instead, they use two measures of underlying inflation which attempt to net out the most volatile price movements.
The concept of underlying inflation is an attempt to separate the trend (“the persistent component of inflation) from the short-term fluctuations in prices. The main source of short-term ‘noise’ comes from “fluctuations in commodity markets and agricultural conditions, policy changes, or seasonal or infrequent price resetting”.
The RBA uses several different measures of underlying inflation which are generally categorised as ‘exclusion-based measures’ and ‘trimmed-mean measures’.
So, you can exclude “a particular set of volatile items – namely fruit, vegetables and automotive fuel” to get a better picture of the “persistent inflation pressures in the economy”. The main weaknesses with this method is that there can be “large temporary movements in components of the CPI that are not excluded” and volatile components can still be trending up (as in energy prices) or down.
The alternative trimmed-mean measures are popular among central bankers.
The authors say:
The trimmed-mean rate of inflation is defined as the average rate of inflation after “trimming” away a certain percentage of the distribution of price changes at both ends of that distribution. These measures are calculated by ordering the seasonally adjusted price changes for all CPI components in any period from lowest to highest, trimming away those that lie at the two outer edges of the distribution of price changes for that period, and then calculating an average inflation rate from the remaining set of price changes.
So you get some measure of central tendency not by exclusion but by giving lower weighting to volatile elements. Two trimmed measures are used by the RBA: (a) “the 15 per cent trimmed mean (which trims away the 15 per cent of items with both the smallest and largest price changes)”; and (b) “the weighted median (which is the price change at the 50th percentile by weight of the distribution of price changes)”.
So what has been happening with these different measures?
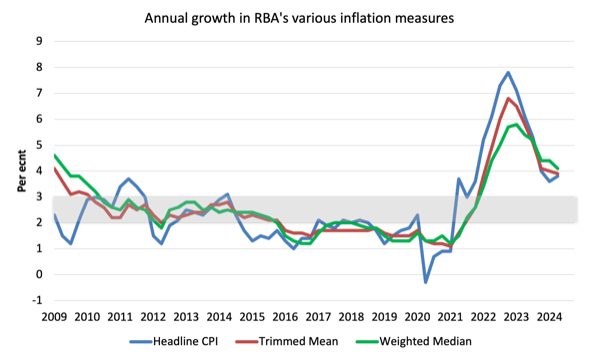
The following graph shows the three main inflation series published by the ABS since the June-quarter 2009 – the annual percentage change in the All items CPI (blue line); the annual changes in the weighted median (green line) and the trimmed mean (red line).
The three measures are in annual terms:
1. The All Groups CPI rose by 1.0 per cent for the quarter (steady) and 3.8 per cent over the 12 months (up from 3.8 per cent last quarter).
2. The Trimmed mean series rose by 0.8 per cent for the quarter (down from 1) and 3.9 per cent over the previous year (down from 4 per cent).
3. The Weighted median series rose by 0.8 per cent (down from 1.1 per cent for the quarter and 4.1 per cent over the previous year (down from 4.4 per cent).
How to we assess these results?
1. The RBA’s preferred measures remain outside the targetting range and they have been using that fact to justify their rate hikes since May 2022 even though the factors that have been driving the inflation until late 2022 were not sensitive to the interest rate increases.
2. They also claimed the NAIRU was 4.25 per cent and with unemployment stable at around 3.9 per cent, they considered that justified further rate rises. However, if inflation is falling consistently with a stable unemployment rate then the NAIRU must be below the current rate of 3.9 per cent.
3. There is no evidence that inflationary expectations are accelerating – quite the opposite and that has been the case for some months now.
4. There is no significant wages pressure.
5. A major contributor to the current situation – rents – are, in part, being pushed up by the interest rate rises.
7. There is no justification for any further rate rises, especially given the slowdown in retail sales noted above.
Conclusion
The latest CPI data showed that the inflation trend is clearly down in line with trends around the globe.
The rental inflation was driven by RBA rate hikes themselves, interacting with a tight housing market, in part, due to the failure of governments to provide adequate supplies of social housing.
The other factor in this quarter that was driving the inflation rate was food and that was due to abnormal weather.
That is enough for today!
(c) Copyright 2024 William Mitchell. All Rights Reserved.
Bill, thanks for your commentary.
There’s one, often unaccounted for factor, contributing to rental increases in Victoria, at least; that being the soaring Land Tax, in some cases $2000 in the past 12 months is not uncommon.
And of course those for whom their investment property supplies some/all of their retirement income, this is going to be passed on to the tenant.
Council rates are also on the up.
Both of these increases are something governments can do something about.
I has been suggested that the Vic Land Tax increases is the method by which the government intends to recoup the costs of combating covid.