Well my holiday is over. Not that I had one! This morning we submitted the…
The transitory inflation conjecture gains even more data credence
Yesterday (November 30, 2022), the Australian Bureau of Statistics released the latest – Monthly Consumer Price Index Indicator – which is a new data series that the ABS has introduced to augment the quarterly CPI index release. Regular readers will know that I have considered this period of inflation to be transitory, which means that it is likely to dissipate rather quickly once the driving factors abate. It doesn’t mean that those driving factors are necessarily short-term in horizon. They might persist. But the important point is that second-round propagating mechanisms such as the wage-price distributional battle over markups are not present as they were in the 1970s, which is why that episode had a life of its own once the initial oil price supply shock adjustment was made. The other significant aspect of my assessment is that this current inflationary period does not indicate excessive fiscal support nor does it justify central banks hiking interest rates. The drivers at present are originating from the supply-side (pandemic, long Covid, OPEC+ and the Ukraine situation) and are not sensitive to any degree to interest rate changes. I have received a lot of criticism for holding this view. The Modern Monetary Theory (MMT) is dead crowd constantly E-mail me or try to push acrid comments on this blog telling me to get another life or end my existing one. The problem for them is that the latest data from around the world is telling me that this period of inflation is peaking as the supply drivers start to wane.
Eurostat data shows inflation has peaked in Europe
The latest flash estimate data from Eurostat – Euro area annual inflation down to 10.0% (released November 30 2022) – shows that:
1. “Euro area annual inflation is expected to be 10.0% in November 2022, down from 10.6% in October”.
2. “Looking at the main components of euro area inflation, energy is expected to have the highest annual rate in November (34.9%, compared with 41.5% in October), followed by food, alcohol & tobacco (13.6%, compared with 13.1% in October), non-energy industrial goods (6.1%, stable compared with October) and services (4.2%, compared with 4.3% in October).”
3. Belgium 10.5 per cent (down from 13.1 per cent in October); Germany 11.3 down from 11.6; Greece 9 down from 9.5; Spain 6.6 down from 7.3; Italy 12.5 down from 12.6; France constant at 7.1; Netherlands 11.2 down from 16.8; Austria 11.1 down from 11.5 etc.
It certainly looks as though the supply drivers are abating somewhat.
Australian inflation also seems to have peaked
I say peaked cautiously because the current flooding in NSW, which is affecting food production may still cause further price pressures in the coming months before a recovery is possible.
But that won’t alter the assessment that this is a supply-side phenomenon and interest rate changes will do nothing to make the lettuces and carrots grow back more quickly.
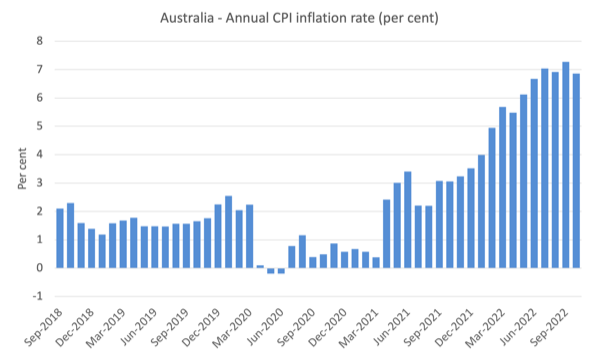
The latest data from the ABS shows that the All Groups CPI increased by 6.9 per cent over the 12 months to October 2022, after recording a 7.3 per cent increase over the 12 months to September 2022.
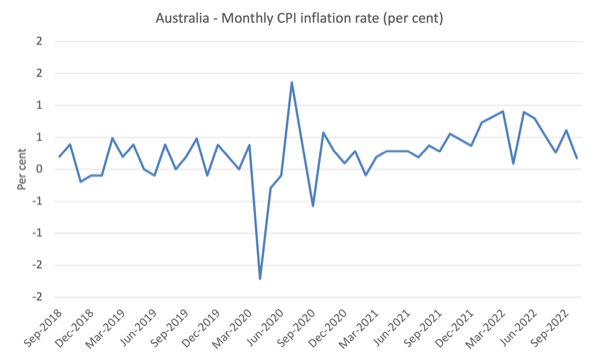
However, the monthly CPI inflation rate for October 2022 came in at 0.17 per cent down from 0.61 per cent and the lowest reading since April 2022 and then since February 2021.
The following graphs shows the annual and monthly CPI inflation rates (respectively).
It is clear that the latest monthly estimate is a break on the previous several months, notwithstanding the recent outlier in April 2022.
When we talk about inflation there are various ways we can express the situation.
1. We can talk about annual inflation – over the last 12 months – and that figure is 6.9 per cent and falling.
2. We can talk about the annualised quarterly rate – given the CPI in Australia has traditionally been published at this frequency – so we would multiply the quarterly rate by 4. That figure in October 2022 would be 4.21 per cent down from 5.64 per cent in September.
3. We can talk about the annualised monthly rate – so we would multiply the current monthly rate by 12. That figure is 2.1 per cent in October 2022, down from 7.34 per cent.
The interpretation of which is a better indicator of the current situation is influenced by the trend of the time series.
It is clear the trend is down and the latest monthly estimate is probably representative of where the series is heading.
Which means that Australia’s inflation problem is passing quickly.
Has this been the work of the RBA interest rate hikes?
The answer is a categorical No!
We can get to that conclusion by examining the components that make up the All Groups CPI outcome.
The ABS press release (November 30, 2022) – The monthly CPI indicator rose 6.9 per cent in the 12 months to October 2022 – noted that:
Each year, the ABS updates the expenditure weights applied to the CPI basket … This is important to ensure the CPI basket remains up to date and representative of current spending by households … Typically, annual updates to the weights have limited impact on the overall CPI. This year, however, the significant changes in spending patterns over 2021 and 2022 meant that the reweight had a larger impact on the CPI than usual. The annual movement of the monthly CPI indicator in October, using the previous weights, would have been 7.1 per cent compared to 6.9 per cent using the new weights.
So we always have to appreciate that these data are statistical artefacts and the if there are changes in the underlying methodology then the estimates change even though nothing substantive has changed on the ground.
When we dig into the components of the All Groups CPI result we find that:
1. Automotive fuel prices rise from an annual 10.1 per cent in September to 11.8 per cent in October. This was entirely due to the federal government decision to end the subsidy being provided by the temporary suspension of the fuel excise tax.
But the underlying trend is down as world oil prices fall.
2. Fruit and vegetable prices which rose quickly due to floods and transport costs fell from an annual figure of 17.4 per cent in September to 9.4 per cent in October.
This is an example of how quickly the situation can change when the temporary supply disruptions ease.
3. Building construction costs rose by 0.4 per cent on top of the 20 per cent in September as a result of labour and material shortages primarily.
The timber shortages go back to the huge bush fires just before the pandemic and also to disruptions arising from the Ukraine situation.
There are also other material shortages due to Covid disruptions in China and elsewhere.
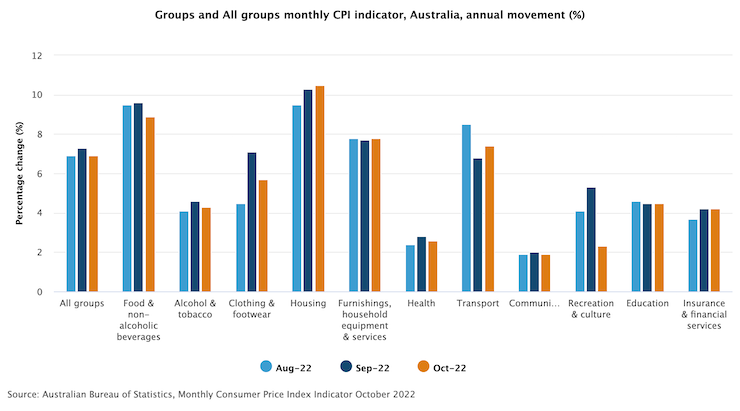
4. Housing overall inflated by 10.5 per cent over the year to October 2022, up from 10.3 per cent in September. So the interest rate increases are doing nothing to quell this sector.
The following graph shows the annual rates for the major All Groups CPI components.
As you can see, the trend is down in most of the component groups.
And what about the impact of fiscal policy?
The purpose of fiscal policy, among other things, is to ensure spending is sufficient to create enough demand in the economy that is consistent with full employment.
At present, Australia’s unemployment rate is relatively low but we would not yet say we are at full employment because the total underutilisation rate is above 9.4 per cent (the sum of the unemployment and underemployment rates).
The main reason the unemployment rate is so low is because the external borders were shut during the early days of the pandemic and migration has not yet fully recovered.
Once the working age population returns to its previous growth rates then the unemployment rate will rise a bit unless total demand increases.
But we can make some assessment of whether fiscal policy has ‘over stimulated’ the economy by looking at the wage situation.
The mainstream view of the link between inflation and unemployment is that when the unemployment rate reaches the so-called Non-Accelerating-Inflation-Rate-of-Unemployment (NAIRU) then the wages pressure that builds at that rate is likely to be consistent with productivity growth and so unit costs are constant and inflation is stable.
The mainstream narrative then would say that fiscal policy is over-stimulating the economy if the unemployment falls below the unobserved NAIRU.
While the NAIRU is unobserved, the manifestation of the over-stimulation according to this story would be excessive wages pressure outstripping productivity growth and driving unit costs up which are then passed on as higher prices.
So, even within that narrative space, if wages growth is weak and the wage share is falling (which means that real wages are being outstripped by productivity growth) then it is difficult to say that the unemployment rate is ‘too low’ and below the NAIRU.
Of course, I don’t buy the NAIRU story at all.
But the fact that wages growth is low and certainly not driving this inflationary episode and that real unit labour costs are falling (evidenced by the wage share falling), tells me that fiscal policy is not over stimulating the demand side.
Unemployment is relatively low but not so low that inflation pressures are emanating from the labour market.
Conclusion
I stand by my earlier assessment in 2021 that this is a transitory inflation and as various driving factors abate, so will the inflation.
There is no structural propagation present.
That is enough for today!
(c) Copyright 2022 William Mitchell. All Rights Reserved.


Bill, the 1st graph has all the dates being “1900”, and either “Jan.” or “Feb.”
Dear Steve_American (at 2022/12/01 at 4.58 pm)
Fixed now. Thanks.
best wishes
bill
Phillips curve slopes are very small in the short-term, and zero in the long-term, no?
What shape is the Phillips curve now? The New Keynesians have managed to invent (bastardise) a curve that changes it’s shape and position to fit the facts (ex-post), yet is always able to post-rationalise their preferred classical theory. It’s a miracle!
It’s a crock of shit. Like the NAIRU, it can only be known ex-post. That makes it useful only as a justification, not a tool.
As for the idea that we need to jack up rates – I note that Mortgage payments were removed from the headline CPI in 1998, as requested by the RBA and Treasury, because jacking rates was increasing inflation. Another miracle! They changed “reality” to fit the preferred theory. The relationship with reality becomes even more tenuous when we hear “hawkish” economists talk about the need for increased unemployment. How does that thought experiment go? Sack some people, reducing production, to solve inflation caused by a lack of supply?
We’ve more than jumped the shark. The group-think in some of these organisations is reaching Branch Davidian levels of insanity now – except it’s the rest of the planet that is being set on FIRE. (intentional pun)
Hi Bill,
Interesting comparison regarding the methods one could use to arrive at an annualised inflation rate. Would it be useful to examine the figure over a longer timeframe also? Surely the economy is not a “sprint race” rather a marathon. In the latter one can fall behind (or ahead) of the goal time during smaller parts of the race. However one could make the goal by minor adjustments along the way. With the Australian Economy, over a period of the last 10-15 years, it would probably be that we are under the desirable growth rate. So having a longer view may have also taken the pressure off the RBA to make interest rate increases?
History.
What is history and how do you analyse the data within it, Is history a truthful account of what happened or political propaganda depending on who is actually writing it ?
The future.
What does the future hold and how do we analyse what it will look like and who will take us there.
Why has the left all but vanished.
The faces we get to choose from at election time in the West are either from the centre right or sit further along the right wing spectrum?
These 3 questions have tried to be answered in many books by many different authors. They are big questions that have challenged many academics over the last 50 years. So what is the consensus, what is the mainstream view and is the mainstream view to be trusted ?
For me, history and the future, was and is, determined by economic policies. You put your policies in place and measure the outcome. However, before you introduce the policies you must have already had a well thought out plan. An ideological picture of what you are trying to achieve.
Cynthia Chung is Editor-in-Chief and co-founder of the Rising Tide Foundation. She has lectured on the topics of Schiller’s aesthetics, Shakespeare’s tragedies, Roman history, the Florentine Renaissance among many other subjects. The Rising Tide Foundation is committed to the belief that the improvement of scientific and technological progress is inextricably tied to the improvement of creativity and moral disposition of every member of society. The Rising Tide Foundation is a non-profit organisation based out of Montreal Canada dedicated to the enhancement of cross-cultural understanding and dialogue between east and west. Support initiatives such as lectures, seminars, and multi media productions that facilitate greater bridges between east and west while also providing a service that includes geopolitical analysis, research in the arts, philosophy, sciences and history.
Cynthia Chung challenges the mainstream consensus on our history and our future. Showing us a different point of view. The geopolitical view from the other side of the fence. A view we would never get to hear or see before the internet.
https://thesaker.is/operation-gladio-natos-secret-war-for-international-fascism/
There are many examples by many different authors that try to give balance to the Western mainstream view. No historical account will ever be accurate regardless who writes it. As a geopolitical and political view will always shape the story being told depending on the author.
However, does this account explain why the Western left no longer exists ?
If not. Why has it vanished from view ?
Will it take another 100 years and a thousand more books to explain it ?
@Derek Henry, No you can’t trust mainstream economists to tell the truth. IMHO, they have to know that 1] their theory is based on logic and false premises which are banned rom true logic, and 2] that their theory has not been able to predict the future as well as just guessing. [That is, that guessing is right 50% of the time and they are right less than that.] So, I deduce that they are part of the conspiracy to make the rich richer. Left politicians sold out between 1981 and 1991. So, they will not tell the truth either.
. . . And, with climate change having triggered the Methane bomb in 2017, things will be getting worse very fast now, so we don’t have time to wait.
The Australian government is currently attempting to put a lid on energy prices by capping the domestic price paid for coal and gas at a level sustainable by households and industry – if they succeed then a major driver of inflation will have been brought under control. The Queensland Labor government and the New South Wales Liberal government are proving to be holdouts since they receive royalties for coal partly based on prices per tonne and are not keen to see prices lowered, even though capping domestic prices would greatly benefit Australia as a whole. Given that domestic consumption only accounts for about a quarter of what is mined and sold, they would still be raking in large royalties on the other three-quarters that are exported. I think they should get with the programme and put the country first.
The Ukraine war and the great geopolitical instability it has brought about will play a large part in determining the course of European inflation for some time yet I think. Europe has been heavily dependent on cheap Russian gas and have stocked up on it ahead of the northern hemisphere winter, stabilizing the situation for the moment. What happens once this has been run down – probably by the end of the first quarter 2023 – and business as usual with Russia has not returned? Can Europe completely replace this energy source at a comparable cost between now and then? I guess we’ll find out.
I doubt they’ll be buying Russian oil at $60 a barrel – more likely I suspect it will make it’s way back to Europe through multi-party arrangements at market prices (partly refined elsewhere then shipped to Europe as the product of a country other than Russia, much the same way as China kept buying Australia’s coal through third parties during a diplomatic spat in recent times and pretended the coal they were buying was not Australian in order to save face) if not a premium.
At any rate, I’m pleased to see some move afoot (though it has to succeed first) to control the price we Australians pay for our own sovereign energy endowment – the jaw-dropping spectacle of a country literally swimming on an ocean of energy production far in excess of it’s own needs yet being forced to pay as though a severe shortage existed here because of a war on the other side of the world…..is one of the most monumentally stupid things I think I’ve seen.
An example of why national/public ownership can deliver superior outcomes for a country than markets.