Here are the answers with discussion for this Weekend’s Quiz. The information provided should help you work out why you missed a question or three! If you haven’t already done the Quiz from yesterday then have a go at it before you read the answers. I hope this helps you develop an understanding of Modern…
The Weekend Quiz – November 17-18, 2018 – answers and discussion
Here are the answers with discussion for this Weekend’s Quiz. The information provided should help you work out why you missed a question or three! If you haven’t already done the Quiz from yesterday then have a go at it before you read the answers. I hope this helps you develop an understanding of modern monetary theory (MMT) and its application to macroeconomic thinking. Comments as usual welcome, especially if I have made an error.
Question 1:
Imagine that macroeconomic policy is geared towards keeping real GDP growth on trend. Assume this rate of growth is 3 per cent per annum. If labour productivity is growing at 2 per cent per annum and the labour force is growing at 1.5 per cent per annum and the average working week is constant in hours, then this policy regime will result in:
The answer is a rising unemployment rate.
The facts were:
- Real GDP growth to be maintained at its trend growth rate of 3 per cent annum.
- Labour productivity growth (that is, growth in real output per person employed) growing at 2 per cent per annum. So as this grows less employment in required per unit of output.
- The labour force is growing by 1.5 per cent per annum. Growth in the labour force adds to the employment that has to be generated for unemployment to stay constant (or fall).
- The average working week is constant in hours. So firms are not making hours adjustments up or down with their existing workforce. Hours adjustments alter the relationship between real GDP growth and persons employed.
Of-course, the trend rate of real GDP growth doesn’t relate to the labour market in any direct way. The late Arthur Okun is famous (among other things) for estimating the relationship that links the percentage deviation in real GDP growth from potential to the percentage change in the unemployment rate – the so-called Okun’s Law.
The algebra underlying this law can be manipulated to estimate the evolution of the unemployment rate based on real output forecasts.
From Okun, we can relate the major output and labour-force aggregates to form expectations about changes in the aggregate unemployment rate based on output growth rates. A series of accounting identities underpins Okun’s Law and helps us, in part, to understand why unemployment rates have risen.
Take the following output accounting statement:
(1) Y = LP*(1-UR)LH
where Y is real GDP, LP is labour productivity in persons (that is, real output per unit of labour), H is the average number of hours worked per period, UR is the aggregate unemployment rate, and L is the labour-force. So (1-UR) is the employment rate, by definition.
Equation (1) just tells us the obvious – that total output produced in a period is equal to total labour input [(1-UR)LH] times the amount of output each unit of labour input produces (LP).
Using some simple calculus you can convert Equation (1) into an approximate dynamic equation expressing percentage growth rates, which in turn, provides a simple benchmark to estimate, for given labour-force and labour productivity growth rates, the increase in output required to achieve a desired unemployment rate.
Accordingly, with small letters indicating percentage growth rates and assuming that the average number of hours worked per period is more or less constant, we get:
(2) y = lp + (1 – ur) + lf
Re-arranging Equation (2) to express it in a way that allows us to achieve our aim (re-arranging just means taking and adding things to both sides of the equation):
(3) ur = 1 + lp + lf – y
Equation (3) provides the approximate rule of thumb – if the unemployment rate is to remain constant, the rate of real output growth must equal the rate of growth in the labour-force plus the growth rate in labour productivity.
It is an approximate relationship because cyclical movements in labour productivity (changes in hoarding) and the labour-force participation rates can modify the relationships in the short-run. But it provides reasonable estimates of what happens when real output changes.
The sum of labour force and productivity growth rates is referred to as the required real GDP growth rate – required to keep the unemployment rate constant.
Remember that labour productivity growth (real GDP per person employed) reduces the need for labour for a given real GDP growth rate while labour force growth adds workers that have to be accommodated for by the real GDP growth (for a given productivity growth rate).
So in the example, the required real GDP growth rate is 3.5 per cent per annum and if policy only aspires to keep real GDP growth at its trend growth rate of 3 per cent annum, then the output gap that emerges is 0.5 per cent per annum.
The unemployment rate will rise by this much (give or take) and reflects the fact that real output growth is not strong enough to both absorb the new entrants into the labour market and offset the employment losses arising from labour productivity growth.
Please read my blog – What do the IMF growth projections mean? – for more discussion on this point.
The question has practical relevance in Australia at present with the recent statement by the RBA that its was hiking rates further because real GDP growth was nearly back on trend. The fact is that the trend growth rate is below the required growth rate and so the monetary policy stance is really locking in higher than necessary unemployment.
Question 2:
Students are taught that the macroeconomic income determination system can be thought of as a bath tub with the current GDP being the water level. The drain plug can be thought of as saving, imports and taxation payments (the so-called leakages from the expenditure system) while the taps can be thought of as investment, government spending and exports (the so-called exogenous injections into the spending system). This analogy is valid because GDP will be unchanged as long as the flows into the bath are equal to the flows out of it which is tantamount to saying the the spending gap left by the leakages is always filled by the injections.
The answer is False.
This is actually an example that has been used in the past by macroeconomics teachers to try to teach students the so-called circular expenditure models with leakages and injections.
The basic flaw is that it confuses stocks and flows. I am sorry that I keep batting on about that but it is crucial to a wider understanding of macroeconomics that the distinction between the two concepts is clear in your mind.
The taps and the drains are conceptually accurate because they relate to flows – all expenditure components, saving and taxation payments are flows which are measures as so many $s per period.
A stock has no such time dimension and the only way we can measure it is to take a snapshot at some point in time.
The flaw then relates to the construction of GDP as the level of water in the bath. This is a stock rather than a flow. In the same way as a reservoir is a storage of water which might be 70 or 80 percent full.
But GDP is just the summation of the expenditure flows and is thus a flow itself.
When then national statistician releases the National Accounts and says that GDP was $x billion in the December quarter, they are referring to the sum total of the flow of component expenditure over the 3 month period (October, November, December). They are not referring to a stock of output (which would be inventories or something like that).
The aspect of the question that is true, however, relates to the statement that GDP will be unchanged as long as the flows into the bath are equal to the flows out of it which is tantamount to saying the the spending gap left by the leakages is always filled by the injections.
However the nuance is that it will be the flow of GDP that will be unchanged. The water level is a poor construction of this flow concept.
Question 3:
Assume the current public debt to GDP ratio is 100 per cent and that the nominal interest rate and the inflation rate remain constant and zero. Under these circumstances it is impossible to reduce a public debt to GDP ratio, using an austerity package if the rise in the primary fiscal surplus to GDP ratio is always exactly offset by negative GDP growth rate of the same percentage value.
The answer is True.
This question plays on the first but investigates a difference aspect of the framework outlined above.
The following Table considers a three-year horizon.
At the beginning of Year 1, the nation inherits a public debt ratio of 100 per cent.
The economy is in recession (g = minus 2 per cent) and the real interest rate (r) is zero (because it equals the nominal interest rate minus the inflation rate).
Under pressure from conservative lobby groups to reduce the fiscal deficit the nation carried over from the previous year, and, also reduce the public debt ratio, the government introduces a fiscal austerity program (with harsh public spending cuts) during Year 1.
The government succeeds in running a primary fiscal surplus of 2 per cent of GDP (note: the fiscal balance, G-T is negative when in surplus) and the economy remains in recession
As a result, by the end of Year 1, the public debt ratio is unchanged but the economy remains in recession.
The general rule is that under these conditions (r = 0), there can be no reduction in the public debt ratio as long as the primary fiscal surplus as a per cent of GDP is exactly equal to the negative GDP growth rate.
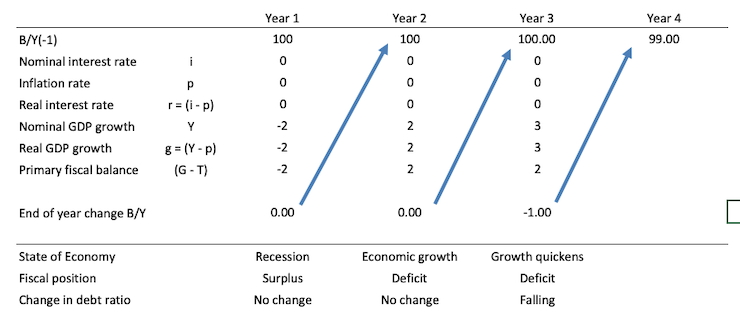
The austerity dynamic, however, is likely to push the public debt ratio up.
Why?
First, if the government didn’t change its strategy and held to its austerity program, then it will probably push the GDP growth rate further into negative territory, which, other things equal, would push the public debt ratio up.
Second, as GDP growth declines further, the automatic stabilisers will push the fiscal balance result towards (and into after a time) deficit, which, given the borrowing rules that governments volunatarily enforce on themselves, would also push the public debt ratio up.
So austerity packages, quite apart from their highly destructive impacts on real standards of living and social standards, typically fail to reduce public debt ratios and usually increase them.
But, our government here is responsible and in Year 2, intent of combatting the recession, the government decides to ignore the public debt obsession and introduces a fiscal stimulus (primary fiscal deficit increases to 2 per cent of GDP).
The economy responds to the fiscal stimulus with a 2 per cent growth rate and exits recession.
Again, the public debt ratio is unchanged.
This is because the fiscal deficit is exactly offset (in percentage terms) by the growth rate.
To further mop up unemployment and slack areas in the economy, the government holds its primary fiscal deficit stimulus at 2 per cent of GDP and the economy’s growth rate improves further to 3 per cent in Year 3.
So by year’s end, the debt ratio has fallen (by 1 per cent).
An economy that is experiencing growth with fiscal stimulus support will typically see its public debt ratio falling. And, the fiscal balance declines because of the higher economic activity.
That is enough for today!
(c) Copyright 2018 William Mitchell. All Rights Reserved.
Probably a stupid question, but where does consumption fit into the bath analogy? If say the G tap was turned down by a parsimonious politician could the water somehow maintain its level through creating itself out of thin air via increased consumer credit?
Dear Cs (at 2018/11/17 at 5:48 pm)
Consumption is a flow.
The correct analogy would be a river flowing with inlets and outlets and the level or volume of the river flow would be GDP.
You can construct the level or volume in terms of expenditure components (C, I, G, X-M) or in terms of leakages (S, M, T) and injections (I, X, G).
They are just different perspectives of the same thing a series of flows.
best wishes
bill
My understanding of Question 2 is that GDP is a flow.
Therefore it is incorrect to use the level of water in a bath tub as a metaphor for GDP. The level of water in a bath tub is a stock, not a flow.
However, if the level of water in the bath tub represents the net financial assets of the non-government sector (reserves + government bonds + physical currency on issue), does the metaphor make sense?
Bill,
Q2. I don’t see why a river is the “correct analogy”. A bathtub is like a wide or deep slow-flowing section of a river, e.g. at a lake or a reservoir. Both bathtubs and reservoirs have a volume/stock of water and also a flow of water between their inlets and outlets. So the stock-flow distinction is not very useful here and it may be confusing.
.
Perhaps a more fundamental reason why the both bathtubs and rivers are poor analogues for an economy is because their plumbing/geography is too simple. Neither has a feedback pump and pipe from the downstream outlet flow back into the upstream inlet flow, i.e. there is no mutiplier or accelerator effect.
My twisted mind. I answered question two correctly but not for the reasons Bill gave. For me it was all about the “wording”… Yes it would be true that “GDP will be unchanged as long as the flows into the bath are equal to the flows out of it.” With that as given, it would then be untrue to claim that it “is tantamount to saying the spending gap left by the leakages is always filled by the injections…. It was the “as long as” on the one hand and the “is always” on the other.
One problem with the bathtub analogy is that if all the taps and drains were turned off — analogous to all activity stopping — the water level would still stay the same. Exceptio probat normam.
See, the answer for question 3 is ‘True’- but only because Bill had not heard of my ‘austerity for the debt holders’ program which reduces the debt to GDP ratio by repudiating the debt in the first place. It is a sure fire method of reducing any and all debt ratios under any circumstances 🙂
Thanks Bill. Out with the bathtub and in with the river ;-). Now my little brain thinks harder I guess the increased consumer credit in the example I gave above could be thought of as a decrease in S in the leakages outlet?
Jerry, on a wicked but friendly note……… is that is the same as “austerity for the private savings holders”? … tut, tut…. LOL
PhilipO, one of the best features of MY “austerity for the debt holders” program is that it didn’t exist until I wrote the previous comment. Perhaps understandably, all the details have not been worked out. So at the moment you might say it is fairly flexible as to just who it would impact. So far, its main reason for existence has been to allow me to pretend my answer to #3 wasn’t necessarily wrong- so it has been working thus far according to plan.
Jerry & Philip,
Defaulting on all of the US national debt would crash the world’s economy so bad it would be a total disaster. Everyone would suffer some. Just about every insurance comp. on earth would be insolvent and many banks world wide to start with.
If Greece defaulted the effect would be more limited, but I assume a lot of Greek banks would fail. And Greece would have to bail the depositors out, at least the med. and small ones.
Steve, it was meant to be a hypothetical and (hopefully) humorous point, designed to get partial credit for my incorrect quiz question answer- not an actual policy recommendation. I agree with you that the US gov defaulting on the debt would be a totally unnecessary disaster. Greece is a different story altogether and maybe they should have completely defaulted ten years ago. I mean they might have employed my ‘austerity for the debt holders’ program and they would be better off 🙂
Actually, as worded I believe the answer to 2 is True. Bill even says so:
“Students are taught that the macroeconomic income determination system can be thought of as a bath tub with the current GDP being the water level… blah blah blah”
And then:
“This is actually an example that has been used in the past by macroeconomics teachers”.
So, students are taught the mumbo jumbo; the answer is true, 😉
@ Steve, Philipp and Jerry
Jerry’s ‘austerity for the debt holders’ might actually be much older than we think. Like MUCH older:
https://michael-hudson.com/2017/01/the-land-belongs-to-god/
Prof. Hudson takes an historical approach on economics and the role of private debt in the rise and fall of ancients civilizations. It is an incredibily interesting read and I highly recommend it. It is also one that frames Jesus Christ as wanting to absolve our debts rather than our sins (think that in German its the same word “Schuld”). As an atheist, I find the idea of Jesus as a rebel against the opprssing debtor class much more appealing thant him as one part (but somehow still all) of some weird three-part-deity.
Essentially, in the old Babylonian culture every 50 years or so the debts of peasants were cleared, since they understood that the exponentially growing interest rate would outpace their earnings no matter what. Especially since one considers, that they harvested once or twice a year, but required food, clothing and housing all year. That year would be called a “jubilee year” or “year of the lord”.
This knowledge is partially based on the interpretation of different translations of the dead sea scrolls. This were found in different caves and declared to be obscure references given this rather “uncomfortable truths”. However, many scholars claim that the caves held the content of the ancient library of Judea, which was moved to avoid being destroyed when Romans ransacked the temples.
Think of it, had Obama absolved the debtor’s of their odious debts instead of protecting the lenders earnings, all that talk of him being a “Messiah” would have actually had some merit.
Best regards!