Successive governments in the UK - Labour and Tory - have pushed the nation to…
British government analysis shows fiscal stimulus effective in supporting growth
The British Office of National Statistics published the – Gross Domestic Product Preliminary Estimate, Quarter 3 2015 – yesterday (October 27, 2015) which showed, unsurprisingly, that the British economy is slowing and heading back into recession under current policy settings. The annual real GDP growth rate declined for the third successive quarter as the impacts of the world slowdown and domestic policy austerity start to take their toll. The British government really has to reflect back on 2012 and realise that with non-government spending weak and a household sector carrying very high levels of indebtedness, now is not the time to be trying to cut discretionary net public spending. There is a need for a public spending injection to restore growth while the world works out which way it is going to go.
The response of Chancellor George Osborne was ridiculous to say the least. He responded to the slowing economy with a post to Twitter saying:
GDP is 0.5%. UK continues to outperform other major economies. But global risks mean we go on with tough decisions to live within our means
Which major economies is he referring to? The Eurozone? I hope not.
But with some millions still either unemployed or underemployed in Britain it would seem that the nation has plenty of idle ‘means’ that could be brought into productive use.
The following graph shows annual (blue) and quarterly (red line) real GDP growth since the March-quarter 2005 up to the September-quarter 2015. The data is preliminary and subject to revision but the slowdown over the last 4 quarters in annual growth is clear.

The next graph shows the sectoral performance. The preliminary estimates do not allow us to investigate the spending components (consumption, investment, net exports).
The major negative impact came from Construction which contributed -2.2 percentage points to the 0.5 per cent overall growth. Services contributed 0.7 points, Production (Mining, Manufacturing, and Utilities) 0.3 points, Agriculture, Forestry and Fishing 0.6 points.
The Government and Other Services drained growth by 0.1 percentage points. Manufacturing drained growth by 0.3 percentage points.
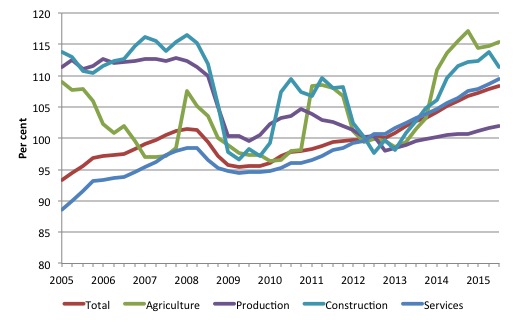
So at present, Britain is growing due to the on-going expenditure of highly indebted consumers being constrained by fiscal cutbacks and a volatile production and construction sector.
The slowdown is clearly centred at present in the manufacturing and construction sectors but the survey evidence available suggests it will also impact on the services sector in the months to come.
How long services can keep holding growth up is unknown but growth cannot be sustained by continuously increasing private debt when government net spending is being cut significantly.
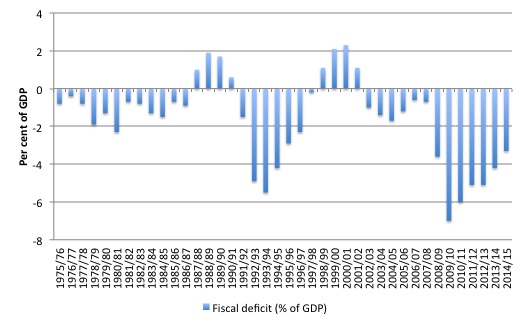
The next graph shows the fiscal balance (as a percent of GDP) with negative results indicating deficits. It is clear that the Tories moderated its austerity push in 2012 to offset a declining economy in that period, which was largely the result of its first two years of spending cuts.
Since that time they have renewed their fiscal retrenchment and growth has stumbled.
Does that fiscal retrenchment really matter?
There was a rather extraordinary document released by the British Office of Budget Responsibility (OBR) yesterday – The Effect of Discretionary Policy on GDP growth.
It was an updated version of Chart 2.10, which was published in the Forecast Evaluation Report October 2014 – and as the name implies attempts to demonstrate the quantitative effect that fiscal policy decisions taken by governments have on real GDP growth.
It is worth reading the original document if you want a deeper understanding of what the latest update is about.
I remind the reader that the dominant paradigm in macroeconomics at the time of the GFC downgraded the importance of fiscal policy as a means of countering the private spending cycle.
The IMF were using estimates of the spending multiplier that were less than one which meant that a $1 of net public spending injected into the economy would generate less than a $1 of total income change – in other words, fiscal policy stimulus actually undermined growth.
This sort of mentality was used to design the bailout programs in Greece, for example and is why the forecasts of growth were positive even in the face of significant fiscal austerity.
Modern Monetary Theory (MMT) clearly adopts the view the fiscal policy is very effective. A $1 injected into the spending stream will generate an initial response of a dollar’s extra output and income, which then has second- and later round effects as that income is spent and extra output is created in response (and so on).
What the graph shows is how effective fiscal policy is, in both directions, in relation to its impact (positive or negative) on real GDP growth.
The graph below is the most recent (supplementary graph) and supporting table produced by the OBR. The graph shows the “shows the impact of discretionary fiscal policy on GDP growth in each year between 2008-09 and 2014-15 on the basis of IFS consolidation estimates at the time of successive forecasts” (IFS – Institute of Fiscal Studies).
The different coloured bars reflect different forecast periods.
The OBR say (in the 2014 document where this graph was first introduced) that “The implications for growth in any particular year depend not just on how large an immediate impact new measures have, but also how quickly the lagged effects of previous policies fade.
The orange bars are what the OBR thought in June 2010 would be the impact on growth of fiscal measures taken at that time. Accordingly, the blue bars are what the impacts were estimated to be when the OBR updated their forecast in March 2014 and the red are their most recent assessments with backcasting.
In the the first two financial years shown (2008-09 and 2009-10), the positive results of the small fiscal stimulus introduced by the British government are shown.
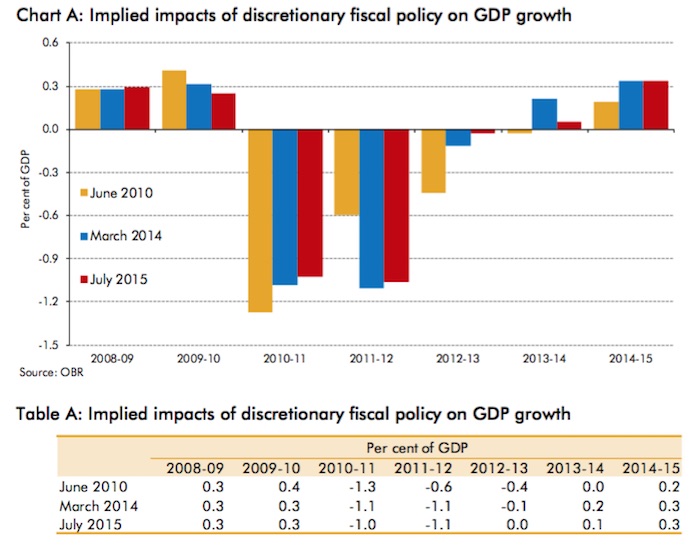
Then the Tories (with the Liberal Democrats) took office in May 2010 and embarked on their austerity drive. The initial OBR forecasts of the impacts of the austerity program (formed at the time of the June 2010 ‘Budget’ – Osborne’s first) were quite dire.
The austerity would undermine growth by -1.3 points in 2010-11, then by -0.6 points in 2011-12, -0.4 points in 2012-13 before dissipating in 2013-14.
They now believe (as at July 2015), that the impacts were less severe in 2010-11 but more severe in 2011-12 (see Table).
By the time Osborne was preparing his 2012 ‘Budget’, real GDP growth was slowing rapidly and Britain was heading back into recession. He moderated his discretionary policy – effectively accepting that the fiscal deficit had to remain more or less at its current level to support growth (see previous graph).
The fiscal impact on real GDP growth was much smaller as a result (virtually zero) and by 2013-14 and 2014-15 the outstanding fiscal deficit was providing the growth support even though the deficit was declining as tax revenue increased on the back of stronger real GDP growth.
The OBR also say that the timing effects are important to understand. So even though the fiscal tightening in 2014-15 was detrimental to growth (-0.4 points impact), the overall positive impact of 0.3 points is due to the positive 0.7 points effect from the deficits from 2013-14 feeding through to growth in the next year.
The effectiveness of fiscal policy is clearly demonstrated by this graph.
The findings clearly suggest that if the British government continues in the coming years to push on with its austerity plans, real GDP growth will suffer. How much? It depends on what happens to private spending and net exports.
In the real world, as opposed to the mainstream macroeconomics textbook world, the positive stimulus that government spending provides to real GDP promotes greater confidence in the private sector – which helps households form consumption decisions and, particularly, is beneficial to firms’ investment intentions.
The opposite is the case. If government fiscal drag is undermining growth at a time when the non-government sector expectations are leaning to pessimism, then private spending might remain subdued or even contract, exacerbating the slowdown.
It is a fair bet that with growth slowing in Britain now further austerity will not only directly damage real GDP growth but will increase the negative sentiment in the private sector.
Conclusion
The OBR analysis demonstrates that the dominant economics view before the GFC was wrong. Fiscal spending multipliers are greater than one and increasing discretionary fiscal deficits is a very effective way to support economic growth.
It also shows that fiscal austerity will undermine growth and the impacts are severe when private spending is weak.
This is also why the IMF reversed direction in late 2012 and apologised for issuing incorrect forecasts based on their faulty multiplier analysis.
The Australian Bureau of Statistics released the quarterly – inflation estimates for September 2015 today and showed an annual rate of inflation of 1.5 per cent. I will analyse them in due course for they are quite interesting.
That is enough for today!
(c) Copyright 2015 William Mitchell. All Rights Reserved.
“So even though the fiscal tightening in 2014-15 was detrimental to growth (-0.4 points impact), the overall positive impact of 0.3 points is due to the positive 0.7 points effect from the deficits from 2013-14 feeding through to growth in the next year.”
Also, a little luck?
“One economist, Alan Clarke at Scotiabank, says the compensation payments have been more successful at stimulating the U.K. economy than quantitative easing. U.K. lenders have already paid £11.5 billion ($18.7 billion) to millions of customers, and have set aside another £7.3 billion for future payments.
But the payments are not just creating one-off windfalls: the PPI industry is also creating much-needed employment.
As we report over on WSJ.com, claims have been coming in at such a clip that it’s created tens of thousands of new jobs to handle them.”
The increased activity (especially transport)inherent in GDP rises is reducing real standards of living.
UK energy balance data is very clear on this.
Massively declining residential energy use and increased transport inputs.
This is especially forcefully seen in the British conduit that is Ireland.
Deflation gets a bad name because in a usury based system its not deflation for all.
People with preferential access to credit and large money deposits benefit.
However we can have deflation for all using the correct equity money system.
The fundamental economic objective of social credit is to raise incomes while deflating prices.
This is impossible in a debt system and indeed fiscal additions is the only option.
We can see that in both euro and so called sov systems such as the UK , the capacity and in particular the local capacity becomes unaffordable over time.
Dork, I can’t understand most of what you have written but what I do understand seems like complete misunderstanding to me.
Postkey, the WSJ is now a Murdoch rag and while they may be right about the PPI employment at the current time, these are temporary jobs, and not very good ones at that, that will disappear when the PPI issue has been dealt with. So, to imply, as the WSJ has done in the quote you used, that these are somehow equivalent to permanent good jobs is facile. But this is what I would expect from that paper as it has since become under its new ownership. Its editorials have never been excellent, but its analyses were sometimes quite good. But, like the Times and The Sunday Times, there have been better times for the paper.
@Larry
I look at the real world with my own eyes and perhaps prejudices but also real input data , social credit theory best conforms to the real world in my opinion.
The US and Uk are nightmare usury jurisdictions also.
So what remains?
I walked around Cork today, boarded up shops everywhere in the city center , no recovery on mainstreat
However the volume of cars has increased to the point of absurdity.
This is the general characteristic of finance capitalism everywhere.
That is massive capital goods overproduction.
Irish private car fuel consumption is now higher then its 2008 crisis peak ( I predicted this after 2013)
Other energy consumption areas of the economy have clearly not recovered.
So much for those hi tech diesel tanks.
I cannot understand why people do not get it.
It’s sort of in your face every frigging day.
If you do not get how war or consumer war economies work ( with their necessary rationing of basic goods)after all this time then I do not know what to say to you.
Except perhaps open your eyes and have one more go at it.