In addition to the basis academic research that occupies my working time and is funded…
Back to 1917 – the wealth distribution in the US
The current evolution of Capitalism is taking the world back to where it was in the early C20th, before trade unions were strong enough to protect workers’ rights, before central governments were willing to mediate the class struggle and step in to make sure workers had the means to enjoy the material prosperity that the system generated, before wages growth allowed workers to share in productivity growth and build a modicum of material wealth. There is no class struggle, Bill! How many times do I hear that now. It is just a convenient sop by those with a vested interest in promoting that view or who has been conned to believe that to be the case. Of course there is a class struggle. Industrial capital might be sharing the hegemony with totally unproductive financial capital and the robber barons of the C19th and early C20th are less prominent and the banksters and the politicians in their pay have replaced them, but don’t ever think that there is a massive conspiracy to undermine the welfare state and put workers back into an even more subservient position than before. Unemployment, part-time precarious work, tax evasion and all the rest of the scams are working a treat.
The UK Guardian reported in the article (November 12. 2014) – Full-time employee jobs account for only one in 40 created since recession – that the British labour market recovery is a chimera.
1. The Guardian reports that full-time jobs as a share of total employment has fallen from “64% in 2008 to 62% in 2014 … That is equivalent to a shortfall of 669,000 full-time employees.”
2. The Guardian reports that “job creation between 2008 and 2014 has been dominated by rising self-employment and part-time work … Employment increased by 1.08m between January to March 2008 and June to August 2014, but only 26,000 were full-time employee roles.”
3. Companies are now using “false self-employment … to evade taxes and avoid paying out entitlements such as holiday pay, sick pay and pensions.”
The British Office of National Statistics will release the latest employment data today and we will have a look at it soon to see what is going on.
By the way, who told the Guardian to redesign their WWW site. It is hard to cope with on first blush. But we will adapt.
Meanwhile, the Australian Bureau of Statistics released the latest – Wage Price Index, September 2014 – today which showed that the annual growth in wage costs was equal to 2.6 per cent.
The following graph shows the annual growth in real wages from the first-quarter 2001 to the September-quarter 2014.
Only the slightest rise in real wages in the September-quarter 2014 after three consecutive quarters of falling real wages.
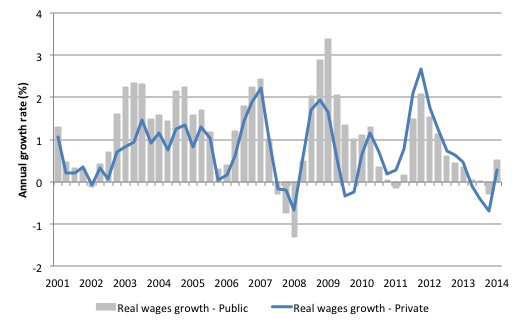
But workers are still not sharing in productivity growth.
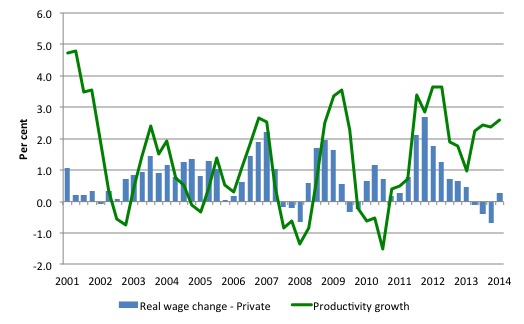
The next graph shows the annual hourly real wage change for the private sector (blue bars) and the annual hourly productivity growth (green line) since the March-quarter 2001. Given the latest national accounts is not out yet, I have assumed productivity growth for the September-quarter 2014 was constant.
Productivity growth is booming at present, which is one reason why employment growth is so flat. For each extra dollar of real output, less workers are needed when productivity growth rises.
The usual payoff is that the rising productivity growth is shared out to workers in the form of improvements in real living standards. Higher rates of spending then spawn new activity, which soaks up the workers lost to the productivity growth.
The problem is that the payoff has been clearly absent over the last 3 years with real wages growth lagging productivity growth.
Real wages growth overall has been negative for the last three quarters (driven by the private sector).
Lagging real wages represent a massive redistribution to profits.
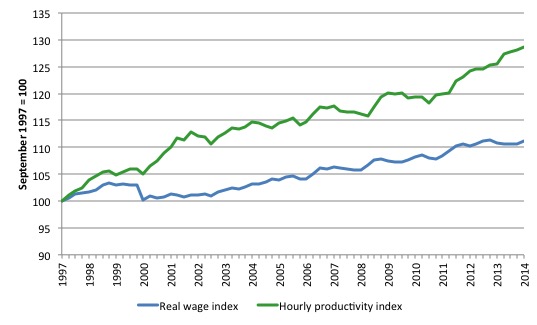
The following graph shows the indexed growth in hourly real wages and labour productivity per hour since the September-quarter 1997. If I started the index in the early 1980s, when the gap between the two really started to open up, the productivity index would stand at around 170 and the real wage index at around 115.
Starting the index in the September-quarter 1997 produces a smaller gap, which just goes to show that one can manipulate data to achieve a range of ends (often quite contrasting) by altering the sample size. That is one of the oldest tricks in the book.
What is clear is that since the September-quarter 1997, real wages have grown by only 10 per cent (so just over 0.6 per cent on average per year), whereas hourly labour productivity has grown by 28.7 per cent (or 1.67 per cent on average per year).
This is a massive redistribution of national income to profits and away from wage-earners and the gap is widening each quarter.
The gap widened in the September-quarter 2014.
Where does the real income that the workers lose by being unable to gain real wages growth in line with productivity growth go? Answer: Mostly to profits. One might then claim that investment will be stimulated.
As the real wage declines and the gap between productivity rises, the Investment ratio (percentage of private investment in productive capital to GDP) has barely risen over the course of the crisis period.
Some of has gone into paying the massive and obscene executive salaries that we occasionally get wind of.
Some will be retained by firms and invested in financial markets fuelling the speculative bubbles around the world.
For workers, the problem is that they rely on real wages growth to fund consumption growth and without it they borrow or the economy goes into recession. The former is what happened around the world in the lead up to the crisis (and caused the crisis).
The latter is more or less what is happening now.
One of the essential changes that needs to happen to ensure that another bout of financial instability doesn’t hit soon is that real wages have to grow in proportion with productivity growth – exactly the reverse of what is happening now.
But the capitalist dynamic now is to repress real wages as much as possible to further entrench the command of profits.
A commentator challenged my claim that fiscal deficits have not been sufficient to match the overall savings of the non-government sector along the lines that households have been so stressed that they cannot save.
That is exactly true. But the households are not the non-government sector. Corporations are highly cashed up at present and refusing to invest in new productive capacity which would stimulate economic growth. As these corporations withdraw from spending, the government has to increase its deficit to ensure that output and income grows and unemployment falls.
In general, that is not happening in many nations at present.
So the Australian experience and the UK experience are just different dimensions of the same dynamic – a movement back to the earlier days of capitalism in terms of how the cake is shared.
The 0.01 per cent
There was a very interesting paper released – Wealth Inequality in the United States since 1913: Evidence from Capitalized Income Tax Data – by Emmanuel Saez (UC Berkeley) and Gabriel Zucman (London School of Economics).
You can also get their – Full Dataset and the Appendix Data – is you are so inclined.
It was reported on in the latest edition of the Economist (Noovember 8, 2014) – Forget the 1%.
In brief, the paper uses income tax returns combined with “Flow of Funds data to estimate the distribution of household wealth in the United States since 1913”.
You can study the paper if you are interested in how they compiled the dataset and computed the outcomes. I will leave that aside. Like everything, one could contest elements of their approach and the way they use the source data but the message would not change much – that is, I consider the outcomes to be relatively insensitive to some of the alternative classifications that one could make.
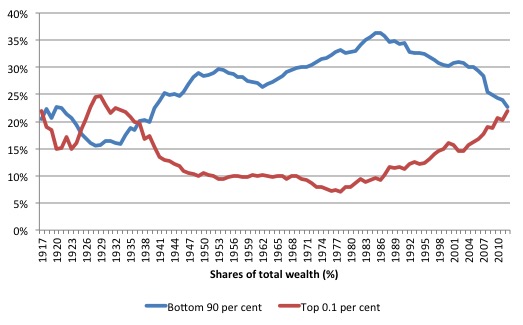
I compiled a few graphs from their dataset. The first shows the shares in total wealth (%) held by the bottom 90 per cent and the top 0.1 per cent from 1917 to 2012. Note that is not the top 1 per cent but the top 0.1 per cent.
The shares are back to where they were in the early 1930s when robber barons ruled.
The top 0.1 per cent now hold 22 per cent of the total wealth in the US about the same as the bottom 90 per cent. The difference is held by the group defined by the 90th to 99.9th percentile which holds 54.4 per cent.
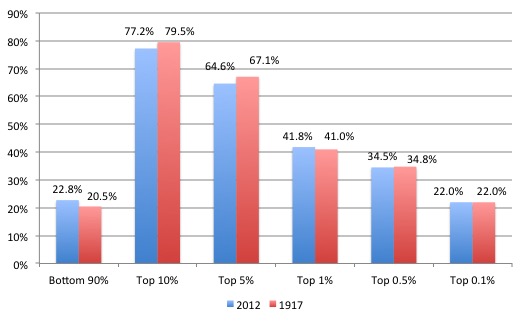
The second graph compares the situation in 1917 to that in 2012 for various wealth cohorts. Draw your own conclusions.
The next graph is Figure 1 from their paper (reproduced) which breaks down the top 1 per cent of the wealth distribution.

The authors concluded that:
On the basis of new, annual, long-run series, we find that wealth inequality has considerably increased at the top over the last three decades. By our estimates, almost all of this increase is due to the rise of the share of wealth owned by the 0.1% richest families, from 7% in 1978 to 22% in 2012, a level comparable to that of the early twentieth century (Figure 1).
Although the top 0.1% is a small group-it includes about 160,000 families with net assets above $20 million in 2012 …
Over the 1986-2012 period, the average real growth rate of wealth per family has been 1.9%, but this average masks considerable heterogeneity: for the bottom 90%, wealth has not grown at all, while it has risen 5.3% per year for the top 0.1%, so that almost half of aggregate wealth accumulation has been due to the top 0.1% alone.
How is this happening? What is the source of the massive wealth accumulation at the top and the fall at the bottom?
The authors leave no doubt as to what their “core finding” is:
The key driver of the rapid increase in wealth at the top is the surge in the share of income, in particular labor income, earned by top wealth holders. Income inequality has a snowballing effect on the wealth distribution: top incomes are being saved at high rates, pushing wealth concentration up; in turn, rising wealth inequality leads to rising capital income concentration, which contributes to further increasing top income and wealth shares.
And as to the bottom 90 per cent – including the “rise of middle-class wealth” – during the full employment era, the authors show that better pension systems and higher homeownership rates saw the “bottom 90% wealth share gradually increased from 20% in the 1920s to a high of 35% in the mid-1980s”.
But with the onset of neo-liberalism, that trend reversed:
… in a sharp reversal of past trends, the bottom 90% wealth share has fallen since then, to about 23% in 2012. Pension wealth has continued to increase but not enough to compensate for a surge in mortgage, consumer credit, and student debt.
The rise in debt coincided with three other causal trends. First, the suppression of real wages (as above) which meant that consumption expenditure could really only be maintained by accessing credit.
Second, the rise of the financial engineers and their elaborate and usually crooked or misleading marketing schemes to force more debt onto the the naive households. This included the rise of the “financial planner” – if ever there was a blight on society, it is this group.
Third, the increasing tendency for national governments to pursue fiscal surpluses, which further squeezed private purchasing power and promoted the credit binge. Remember a government surplus (deficit) is to the dollar a non-government deficit (surplus). There is no way around that accounting statement.
A rising non-government deficit means more private debt and an erosion of wealth. Further, fiscal surpluses destroy private wealth. So the austerity that neo-liberalism has attempted to master squeezes private wealth holdings from both directions.
The authors conclude here that:
The key driver of the declining bottom 90% share is the fall of middle-class saving, a fall which itself may partly owe to the low growth of middle-class income, to financial deregulation leading to some forms of predatory lending, or to growing behavioral biases in the saving decisions of middle-class households.
Conclusion
All these trends and facts are interrelated. The top-end-of-town has captured governments (with payola and social networks etc) and used their legislative power to undermine regulations and other systems (income support etc) and attack trade unions etc to shift the income (and hence wealth) distribution system in their favour.
It is a conspiratorial outcome.
The neo-liberals talk about the sanctity of ‘markets’ by which they pretend is the ‘invisible hand’ of the price mechanism (demand and supply) that gets rammed down the throats of economics students at universities.
That is not remotely what goes on in the economy. Markets are rigged in favour of the top-end-of-town and increasingly, as this research shows to the very top-end.
When they talk of market forces they really mean every dirty trick including criminal practices which undermine the capacity of workers to keep their place in the income distribution.
A lot happened in the early C20th – trade unions formed and expanded, social democratic parties emerged, and eventually the power of the elites was reduced and the levels of income and wealth inequality fell dramatically.
The workers will only be put down for so long. There was a reason why those progressive forces developed back then.
The task is to stimulate them again and that will mean ditching the leadership and mechanisms that have evolved to promote leaders of the so-called progressive politics.
It means getting rid of neo-liberal economics, the euro nations exiting, the corporations reigned in, and most importantly, declaring most of the financial market transactions illegal (given they do nothing productive at all).
That is enough for today!
(c) Copyright 2014 William Mitchell. All Rights Reserved.
Straight to the point! Nailed it again! Great post!
“By the way, who told the Guardian to redesign their WWW site.”
Fashion did. Just as fashion told people to label a size 14 women ‘Plus Size’.
Sometimes I despair. Thank the stars for Bill’s daily dose of rationality
I subscribe to the conspiracy theory that media news outlets with comment facilities have been redesigned to make it more difficult for the public to share ideas. The BBC did it a few years ago and the new Beta format at the Guardian, if that’s what we’re talking about, is a similar case in point.
Hi,
” The top 1 per cent now hold 22 per cent of the total wealth in the US ”
The chart legend talks only about the top 0.1 percent. Where is the mistake.
Thanks a lot for your excellent blog.
Best,
Who told the Guardian that heir editorial ToCs would be better without article dates and often even authors’ names?
As usual, the rationale is masterful Bill; the presentation represents a valid argument for rectifying a backward step in the development of mankind. Even free-market apologists would see the logic of your criticisms about equality – in both societal and economic terms.
What needs to happen then is for a political momentum to build up behind your arguments so that voters return a government that will deliver the policies which your impeccable logic warrants; except the average man/woman distrusts the average politician with the same rancour that you display for the average financial industry executive.
Influential economic commentators have already bought into your economic reasoning and that is starting to percolate through the media; they may describe it differently to your blogs but remember they have an economically ignorant mass market to attract.
It does not help the cause if a middle-aged economic ideologist is ranting on a daily basis about souls who don’t get the message despite seeing their lifestyles disappearing in debt. You know what the problem is; the practicalities of getting from where we are to where you want us to be. But that has invariably been the problem in economics, because the road is quite often poorly mapped and rarely accomplished without setbacks.
Furthermore what you are advocating is a return to possible confrontations between groups of workers and management. It may be justified on the basis of your argument but are you seriously of the mood for a repeat of the battles of the late 20 century. There has to be a saner method of bringing the economic argument to a head without recourse to methods that are more reminiscent of the 1917 battlefields than industrial relations.
We also have to be careful to range each argument against its contrasting viewpoint; there may for instance be more than one explanation for the surge in corporate earnings alongside the obvious conclusion that it is greed.
Andy,
It may soon become easier to share ideas:
http://neweconomicperspectives.org/2014/09/re-invent-democracy-platform-mmt.html
This is wonderful stuff Bill.
I have followed MMT for awhile and hadn’t checked your website much before, shame on me. I decided to look up ‘robber baron’ and this is how wikipedia describes them:
“By the late 1800s, the term was typically applied to businessmen who used what were considered to be exploitative practices to amass their wealth.[2] These practices included exerting control over national resources, accruing high levels of government influence, paying extremely low wages, squashing competition by acquiring competitors in order to create monopolies and eventually raise prices, and schemes to sell stock at inflated prices[2] to unsuspecting investors in a manner which would eventually destroy the company for which the stock was issued and impoverish investors.”
Things haven’t changed much, eh? It is all rather sad but it feels as though the time is getting near for the people to reassert themselves. Does anyone have any recommended books about the robber baron era, leading up to great depression etc.?
In the Harvard Business Review September 2014 issue William Lazonick provides a critical opinion of the practice of stock buybacks, claiming it is largely responsible for the recent huge divergence between the top US earners and the vast majority of the population https://hbr.org/2014/09/profits-without-prosperity. Stock-based awards he points out make up the majority of pay for many corporate executives.
The divergence between the top and bottom end of the economic strata has been recognised by Janet Yellen, chair of the Federal Reserve, among others. It is time that they put their concerns onto a formal footing designed to change the economic environment that creates this obscene level of inequality.
The challenge extends further than merely restricting the use of stock buybacks; it calls for a public explanation of what has been happening to the structure of economic activity, its effects on the type of employment available and its impact on earning capacity, compared with say the post-war period up to the 1970’s.
Without this public dialogue the prospect of a scenario that Bill implies will increasingly look inevitable.
Warren Buffet: There is a class struggle … but only one class is fighting.
Agree with everything you said on this subject, Bill, but take issue with one thing you didn’t say but should have said, and that is that free trade played a big role in torpedoing the American working class. Free trade effectively killed private sector unions and private sector worker bargaining power — for those lucky enough to still have a job in the private sector. Meanwhile the ruling class has profited from free trade.
Regarding the change in fiscal policy — in the US, it’s not so much that fiscal policy changed as that our trade balance changed and our fiscal policy failed to adjust for the increased demand leakage.