I have been a consistent critic of the way in which the British Labour Party,…
The March of the Makers – out!
I have noted before that the longer the economic crisis continues and the more data that comes out from national statistical agencies the easier it is to see how crazy the political elites who are driving austerity in their lands are. A few years ago it was a contest of ideas – austerity or not – and so anti-austerity arguments could be dismissed as “old fashioned”, “worn out”, Keynesian ideas. As the years pass the contest of ideas is being clarified by the relentless data releases from the agencies. Then those who advocate austerity have to not only explain at a conceptual level how a government can cut spending when non-government spending growth is weak and still forecast rapid growth but also have to somehow come to terms with the data that tells them their bets were wrong.
On March 23, 2011, the British Chancelor of the Exchequer George Osborne was still firmly in control of the debate. It was his second budget in government and the economy was still being supported by the budget deficits that the previous government had allowed to grow in the face of the crisis, which emerged in late 2007, early 2008.
The data hadn’t turned against the Government by this time. The economy was still in recovery mode although the signs were ominous.
On that day, the Chancelor delivered his – Budget Speech – and early on in that Speech he said that he was introducing a:
… Budget that encourages enterprise. That supports exports, manufacturing and investment. That is based on robust independent figures. A Budget for making things not for making things up. Britain has a plan. And we’re sticking to it.
I am sure he used the term “support” in a positive way although as the data has evolved it would have been a correct statement if he indicating his budget would contribute to the demise of exports, manufacturing and investment. One might say challenge my view and suggest that the external economy is mostly affected by developments elsewhere, which is true.
But those developments are of the same ilk as the fiscal austerity being imposed in Britain. Further, if the external environment is weak, then it is the responsibility of the national government to stimulate the domestic production and allow manufacturing exporters to switch to local markets inasmuch as they can.
The Chinese switch to strengthening their domestic demand in 2008 is a classic example of what to do if export markets falter.
Anyway, in his 2011 Speech and after outlining the continuation of his plans for imposing fiscal austerity on the economy he ended with a barrage of jingoist triumphalism:
We are only going to raise the living standards of families if we have an economy that can compete in the modern age.
So this is our plan for growth.
We want the words:
‘Made in Britain’
‘Created in Britain’
‘Designed in Britain’
‘Invented in Britain’
To drive our nation forward.
A Britain carried aloft by the march of the makers.
That is how we will create jobs and support families.
We have put fuel into the tank of the British economy.
The march of the makers hasn’t been a long one. In fact, it hasn’t been much of a march at all.
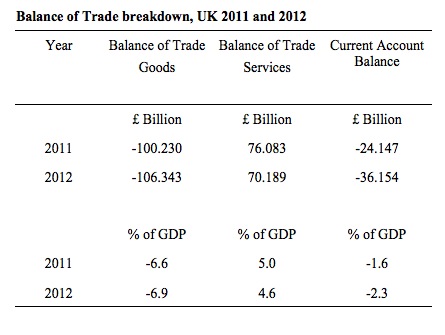
The latest data from the British Office of National Statistics published yesterday (March 27, 2013) is summarised in the following Table.
In 2011, the Current Account deficit was £24.1 billion. This rose to £36.1 billion in 2012. The breakdown of that change is as follows:
- The balance of trade on goods was in deficit to the tune of £100.2 billion in 2011. In 2012, this deficit rose to £106.3 billion.
- The balance of trade on services was in surplus to the tune of £76 billion in 2011. This dropped to £70 billion in 2012.
- Taken together the trade deficit rose by around 50 per cent in 2012 from its balance in 2011.
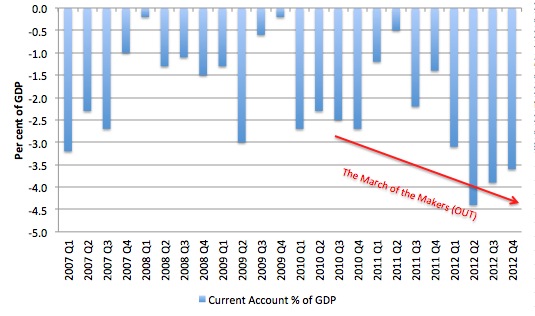
The following graph shows the Current Account balance as a percent of GDP from the first-quarter 2007 to the fourth-quarter 2012. The March of the Makers appears to be absent.
An increasing Current Account balance should not cause alarm if domestic policy settings are sound – why? – because it means that Britain is enjoying a quantum of real imports without having to ship an equivalent real value of its resources (embodied as exports).
But from the the perspective of the logic used by the British government to explain its policy approach, the latest data represents a monumental failure of its policy strategy.
As Larry Elliot said in the UK Guardian article (March 27, 2013) – March of the makers? Balance of payment figures make dismal reading:
The balance of payments figures for 2012 make dismal reading … The situation in the eurozone – Britain’s trading partner – has clearly not helped matters. It is not, however, the whole story. Britain’s manufacturing base has been hollowed out by the three big recessions since the early 1980s, and that has resulted in a reduced capacity to take advantage of a falling currency. What’s more, part of the competitive advantage from the 25% drop in the value of the pound from its pre-crisis level has been eroded by the UK’s poor productivity record in recent years.
The hollowing out of the manufacturing capacity, which began as Britain’s imperial influence declined, gathered pace under Margaret Thatcher’s insistence that all industries face the discipline of the “market”.
British manufacturing declined by around 25 per cent between 1971 and 1981, while the deregulated financial market environment led to the boom in financial services. The over-representation of financial services in the British economy now, which made the British economy more vulnerable thatn most to the collapse in 2007 and 2008 begain with Thatcher’s manic deregulation.
The March of the Makers came to an abrupt halt under Thatcher’s contractionary regime. The persistently high unemployment during the 1980s in Britain was mostly the result of the demise of manufacturing.
The economic growth that came in the late 1980s was largely the result of the growth in financial services.
The British ONS also released the – Quarterly National Accounts, Q4 2012 – yesterday, which confirmed that the British economy is not marching to the makers but, instead, marching into recession.
The major elements of the December-quarter performance were:
- Real GDP growth fell by 0.3 per cent in the December-quarter.
- The main reasons for the contraction were a slump in private investment (0.2 per cent) and the deterioration in the external accounts.
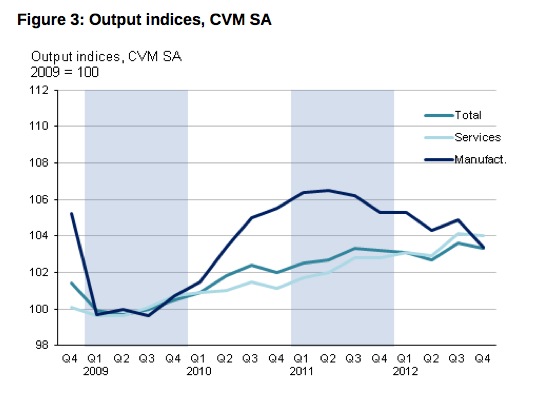
Here is another view of the “March of the Makers (Out)”. This graph is taken from Figure 3 of the latest ONS publication – Quarterly National Accounts, Q4 2012.
Since the current government took office, real Manufacturing output has steadily declined. As I noted above, fiscal austerity is to blame for that. Both the austerity in Europe and in the UK. We cannot blame the UK government exclusively for the decline.
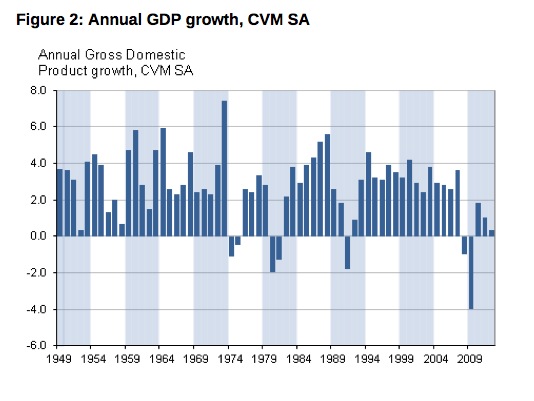
The following graph (taken from Figure 2 of the ONS National Accounts publication) is interesting. It shows real annual GDP growth from 1948 to 2012.
The interesting thing for me was: (a) the depth of the current recession; and (b) the weakness and short-lived nature of the current recovery compared to the previous years after the troughs.
It is quite clear that in previous recoveries the economy recovered more quickly. In the current recovery, the 2010 response seemed to be consistent with previous bounce-backs, given the depth of the 2009 trough. But once the current government enacted its fiscal strategy the recovery evaporated and the economy has been heading south ever since.
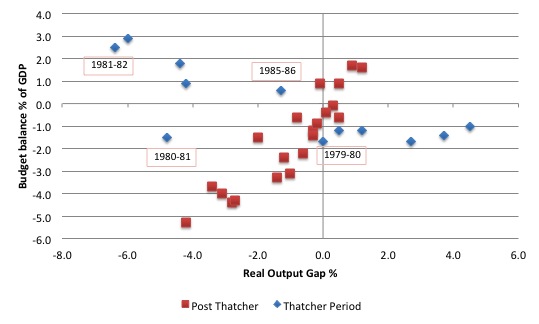
You might wonder about the 1980s which was the period (1979-1990) that Margaret Thatcher was Prime Minister. The following graph uses data available from the HM Treasury – Public finances databank February 2013 – and shows the real GDP Output Gap (%) on the horizontal axis and the Budget Balance as a % of GDP on the vertical axis.
I split the sample from 1979-80 to 2011-12 into two sub-samples: (a) the Thatcher period; and (b) the Post-Thatcher period.
The Post-Thatcher period observations are consistent with normal outcomes driven by the automatic stablisers. As the output gaps increases, growth in tax revenue falls (or is negative) and welfare-based outlays rise. The budget deficit thus typically increases as it should to support aggregate demand.
On top of the cyclical effects (the automatic stabilisers), discretionary (counter-cyclical) shifts in public net spending also allow the budget deficit to rise when there is a slowdown or slump in non-government spending.
The Thatcher period violated this typical behaviour.
When she came to office there was a zero output gap (remember the Treasury estimates of the output gap are likely to be biased downwards). The budget was in slifht deficit (1.7 per cent of GDP).
Within two years the budget was in surplus of 2.9 per cent of GDP and the output gap had ballooned to 6.4 per cent and a massive downturn was underway.
Despite trying to run against the cyclical tide, the budget gradually moved towards and into deficit towards the mid-to-end 1980s and the output gap declined.
Part of that was a comeback of private industry, which was (as noted above) mostly related to investment in the financial services. I will analyse that period in another blog later this year as I am working on a book documenting the Monetarist era.
I get many E-mails asking me to explain the Thatcher period from an Modern Monetary Theory (MMT) perspective and when I get time I will decompose the data movements and explain what I thought was going on. I lived and studied in Britain during that period and have a first-hand experience of what was happening on the ground in industrial towns such as Manchester.
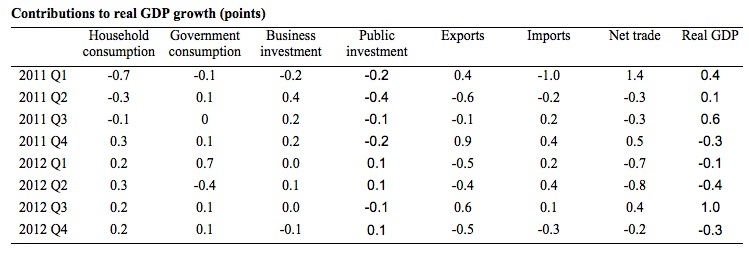
What is driving the contraction in British output? The following Table shows the contributions to real GDP growth by expenditure compoent since 2011Q1.
The interesting thing is that despite the austerity intent of the government the rising budget deficit (as a result of the cyclical decline) is still supporting growth (in the sense that it is attenuating the contraction arising from private investment and net exports.
This graph (Figure 4 in the ONS publication) shows real Manufacturing growth (quarterly) since the end of 2007. The March of the Makers (Out) is consistent (despite the September-quarter blip).
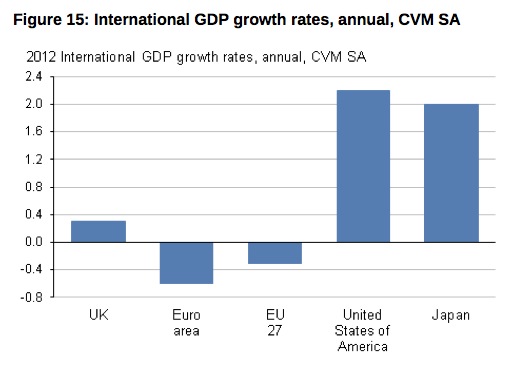
The British ONS also produces an Austerity versus Deficit-supporting-growth graph (although they don’t exactly call it that). They prefer the title “International GDP growth rates, annual CVM SA”. Here it is (Figure 15 from the ONS publication).
Not much argument to be had there!
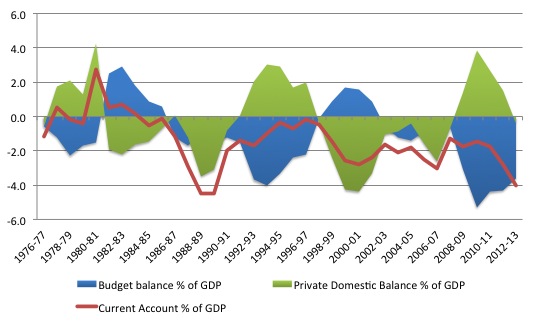
I also updated my sectoral balances database for the UK today. You can get data from – Public finances databank February 2013 – from HM Treasury and the – Balance of Payments, Q4 2012 Dataset – compiled by the British Office of National Statistics.
The private domestic balance is computed as a residual balancing item given the other two balances – external and government – are fairly reliable.
The data is for financial years and the 2012-13 are estimates. I think the Budget Deficit will be larger than the Treasury estimate of 3.6 per cent of GDP. The external balance is heading to be around 4 per cent of GDP.
The brief statement of these balances is:
(S – I) = (G – T) + (X – M)
The three balances have to sum to zero as a matter of national accounting. The sectoral balances derived are:
- The private domestic balance (S – I) – positive if in surplus (overall private spending is less than income), negative if in deficit (overall private spending more than income).
- The Budget Deficit (G – T) – negative if in surplus, positive if in deficit.
- The Current Account balance (X – M) – positive if in surplus, negative if in deficit.
The private domestic and the current account balance sum to be equal to the non-government balance. The basic result that the government balance equals exactly $-for-$ (absolutely or as a per cent of GDP) the non-government balance (the sum of the private domestic and external balances).
As I noted last week when I analysed the British Budget the familiar pattern is evident. There is a reciprocal relationship between the budget deficit and the private sector balance. When the British government ran surpluses in the late 1980s and then later in the period 1997-2001, the private domestic sector moved sharply into deficit.
More recently, the larger deficits driven both by discretionary stimulus measures in 2008 and 2009 and the automatic stabilisers associated with the downturn in the cycle, allowed the private sector to achieve higher savings overall.
The highly indebted private sector is now being squeezed again by the attempted fiscal reduction. in the 2012 British Budget, the implicit strategy was that growth would come from an increase in private sector debt driving consumption and investment spending (refer back to the Table 1.1 above) and net exports.
The expectation is that by the end of the current financial year (2012-13), the Government’s strategy accompanied by the continued decline in the external situation, evident in yesterday’s data release, will drive the private sector into deficit overall.
This is at a time that business investment is also weak or contracting.
Given the indebtedness of British households (overall) this fiscal strategy is crazy.
Conclusion
Britain is declining in economic terms. The situation in Europe is not helping but given the deterioration across the Channel, there was a need for a major shift in fiscal strategy to allow expenditure to be switched to the domestic economy.
As a result of the ideological stubbornness of the British government the aggregate policy settings are exacerbating the external conditions and the British economy is contracting again.
They are lining up for a triple-dip recession and in a few months we will know whether that is the case. Notwithstanding what the data shows (that is which side of the zero growth line the economy ends up in the March-quarter) the current policy strategy has failed and should be reversed.
That is enough for today!
(c) Copyright 2013 Bill Mitchell. All Rights Reserved.

I think the UK is exceptional for having a massive amount of corporate debt owed between financial institutions. We have about £10T of such debt which is about as much as the gross assets of UK households. I guess that debt built up since Thatcher’s time and such credit expansion acted a bit like government deficit spending does in boosting the economy. Of course it couldn’t expand forever and so we are where we are having become reliant on such credit expansion. I wonder whether 2008 wasn’t a missed vital opportunity to wipe the slate clean. If we had let all of those debts come tumbling down with a cascade of defaults then we wouldn’t have the endless attrition of attempting to deleverage. It riles me that we have an army of people employed at the now state owned Royal Bank of Scotland being paid vast amounts to “defuse the most toxic financial construction ever assembled” or however the boss of RBS described it so as to justify the amount such people were paid. Those are the same people who assembled it in the first place. IMO it should have just been written down. Those people are extremely clever and highly educated and so if the place had simply been shut they would have got good jobs elsewhere doing something useful. The government could then have used its powers to support the rebuilding of a real economy rather than propping up a debt zombie.
The 2012 rise in the negative balance of trade in goods should be looked at with some caution as the UKs role as the worlds financial center drags in physical stuff with a monetary role also , such as works of art , precious stones and especially in 2012 – Silver.
That 6 billion ~ extra of a real goods trade deficit can be almost entirely explained by the spike in silver imports.
However ONS will not publish this stuff in detail anymore so us plebs will not really have much of a idea of the gaming of wealth (and not creation) which London excels at.
Hi The Dork of Cork, do you know what drive the interest in silver?
Also I am not sure MMTers fully grasp the dynamics of a so called sov country without a large domestic hinterland interacting with a currency union.
UK “services” surplus only recycle the physical wealth of their modern India which is the EU.
The British Physical trade deficit is simply massive.
You can see the change of British trade in the early 80s “big bang” period quite clearly as the European monster was beginning to form.
Again another step up in the mid to late 90s after the first mini me proto Euro EMU crisis which was a consequence of the Big Bang / Euro nightmare.
The UK & England before it is simply tied to the banking system at the hip.
You can see this in their flag for God sake.
There is a deep history of the sov power making concessions to the global banking system so that his or hers asset values could rise.
To understand the hybrid nature of British nation / banking state history one needs to look no further then their flag.
Prince Edward, Duke of Kent, supports this theory:
“The St. George’s flag, a red cross on a white field, was adopted by England and the City of London in 1190 for their ships entering the Mediterranean to benefit from the protection of the Geonoese fleet. The English Monarch paid an annual tribute to the Doge of Genoa for this privilege.”
http://en.wikipedia.org/wiki/St_George's_Cross
What is the modern version of the Bank of St George to do now ?
There is no more worlds to conquer.
I.e. – the banking system cannot scale up & out or reach further into the future to extract todays resources.
(Second identical post, correcting a foolish HTML mistake.)
(p)(1) “(S – I) = (G – T) + (X – M)
The three balances have to sum to zero as a matter of national accounting.”
This equation and statement are justified by recognizing that GDP is the sum of all the domestic transactions in the economy, and by definition, every transaction is composed income and expense. The parent equation is
(2) G + X + I = S + T + M = GDP
which is simply a rearrangement of equation 1.
It is logical to compare GDP year to year. Equation 2 cannot do this correctly if the units change which is what happens if the money supply changes. Before we can correctly compare GDP year to year, we must make an adjustment for the change in money supply.
We can make an adjustment for money supply change by adding a term to the equation 2. I suggest using the term PB which translates to Printed/Borrowed money used to balance the government budget, the source of all increases or decreases in the national money supply. Equation 2 becomes
(3) G + X + I = S + T + M + PB = GDP.
It is instructive to consider the move from equation 3 back to equation 1 while including the extra term. The printed/borrowed money affects every term and can not be assigned to any sector (but, FWIW, G = T + PB). Printing and borrowing by government affects every sector.
The take-away here is that when we hear that GDP has increased by 2% but the the good news ignores that the money supply has increased by 8%, we are the victims of selective information. The real economy has not increased by 2% but something less and may have even contracted.
@Esp
I really have no idea what goes on in the inner sanctum , I see it as a proxy for gold movements
Gold is where credit money and not fiat goes to die.
As for the remaining rump physical economy.
Nation state post war core investments cannot now be made as any surplus from domestic austerity and or net imports is wasted by banking credit creation of useless conduit assets.
Its why they shut down their Nuclear programme.
This has got planning but will probably not be built.
https://www.gov.uk/government/news/new-nuclear-power-station-gets-planning-permission
They can get planning permission alright but Nuclear needs demand………negative demand means no Nuclear.
Anyway this would produce surplus power which would push down the price of energy hurting private utility profits as they need scarcity.
This planned construction will not happen under the current market state system.
On a brighter British / Northern Ireland theme (which functions as a control for the South) transport data (especially rail) continues to be in better shape then the south which needless to say has imploded on a biblical scale.
http://www.drdni.gov.uk/ni_road_and_rail_transport_statistics.htm (published 28 March)
This is combination of fiscal transfers and more optimal monetary conditions no doubt.
For the first time NIR has carried more then 3 million people in a quarter (3.01 m Oct – Dec) despite the Derry line being closed during that time
“Weekly average rail passenger journeys have increased by 5% from 0.22 million to 0.23
million since the corresponding quarter of 2011 (Table 5.4, Figure 5.1).
• Weekly average rail passenger miles have increased by 6% from 4.09 million to 4.32 million
since the corresponding quarter of the previous year (Table 5.4).
• Compared to the same period in the previous year, the weekly average rail passenger receipts
increased by 9% from £0.66 million to £0.72 million (Table 5.4).”
“NIR is the only commercial, non-heritage, passenger operator in the United Kingdom to operate a vertical integration model, with responsibility of all aspects of the network including running trains, maintaining rolling stock and infrastructure, pricing etc.”
So me thinks the rise in UK passenger numbers has got nothing to do with British neo liberal transport policy.
Its a consequence of monetary policy interacting with energy availability.
It is important to note that (2) is a definition of “GDP”, or, equivalently, the term, GDP. The question then becomes what is the cognitive status of (1) – substantive proposition or definition? Whichever you select, the cognitive status of (2) doesn’t alter.
If one chooses to treat (1) as a definition, then it doesn’t have a truth-value, as it is only telling you the meanings of terms. Usually, the definiens is on the left and the definiendum on the right. To me, it looks like a substantive proposition. Since it has been borrowed from another theoretical schema, it appears to function as an axiom in MMT, where its terms are undefined in MMT or defined elsewhere in MMT.
The cognitive status of a statement is determined by whether that statement is considered to have a truth-value, that is, to be true or false. If no truth-value, then the statement is a complex definition.
Roger’s algebraic manipulations hold whichever is the case.
Since there are two ways of defining GDP, it is best to differentiate them in some way, say, by a subscript.
A fundamental mistake has hard wired income inequality, watch the following to understand…
1) Why one of the most basic assumptions in modern economics and portfolio theory is wrong
2) When and why it happened
3) How it propagated to today
4) Why wealth inequality is inherent in the mistake
and curiously…. that the prevailing community will not hear him out although the Royal Society has published him and one of the 3 Nobel Laureates that unknowingly propagated the mistake has admitted it….
http://blip.tv/greshamcollege/timeforachange_olepeters2-6474835
jrt,
I have paused the video at the 13min mark. It is interesting. So far it tells me that in a game you might expect to do well in, the overall population – on average – does well. But the average return is greater than zero due to few outliers (individuals) doing really well. And the median return is well below zero because over a long enough time period, the vast majority end up destitute even though the rules seem to be favourable at the outset.
Thanks ofr posting this. I will keep watching.
jrt,
In terms of wealth inequality, if the implication of that video is that this arises naturally, then there’s nothing new about that. Perhaps the important implication of this video is the process by which inequality naturally becomes increasingly entrenched over time. And since you can’t go back in time, the destructiveness of the system we live in results in more and more instability and ever increasing inequality. The speaker talks about GDP as an ensemble average, and that this has no regard as to who’s participating in the wealth. Hence, even NDP per capita adjusted for changes in the terms of trade (an indicator of purchasing power) doesn’t shed light on the gains of economic agents as the majority might go to the politically well-connected, while others battle away on Newstart.
Thanks again for posting the video.
Role of the government is to provide good customers to enterprises not to encourage them, whatever that could mean.
Population with good incomes and employed are best customers that enterprises need (AD), anything else would be medling into the market and skewering the signals.
Good customers are provided with redistributive taxes, job guarantee and strong social safety net. Experiences troughout time and places show that clearly.
Training on the job was the norm, government can not provide training for every specific job, nor should it tried to as the neoliberal bs is selling to the people.
My earlier posting contains a math error that I made when translating terms X and M which relate to exports and imports. The two terms must remain paired when related to GDP. The corrected posting follows:
(1) “(S – I) = (G – T) + (X – M)
The three balances have to sum to zero as a matter of national accounting.”
This equation and statement are justified by recognizing that GDP is the sum of all the domestic transactions in the economy, and by definition, every transaction is composed income and expense. The parent equation is
(2) G + (X – M) + I = S + T = GDP
which is simply a rearrangement of equation 1.
It is logical to compare GDP year to year. Equation 2 cannot do this correctly if the units change which is what happens if the money supply changes. Before we can correctly compare GDP year to year, we must make an adjustment for the change in money supply.
We can make an adjustment for money supply change by adding a term to the equation 2. I suggest using the term PB which translates to Printed/Borrowed money used to balance the government budget, the source of all increases or decreases in the national money supply. Equation 2 becomes
(3) G + (X – M) + I = S + T + PB = GDP.
It is instructive to consider the move from equation 3 back to equation 1 while including the extra term. The printed/borrowed money affects every term and can not be assigned to any sector (but, FWIW, G = T + PB). Printing and borrowing by government affects every sector.
The take-away here is that when we hear that GDP has increased by 2% but the the good news ignores that the money supply has increased by 8%, we are the victims of selective information. The real economy has not increased by 2% but something less and may have even contracted
Roger: “The parent equation is
“(2) G + (X – M) + I = S + T = GDP
“which is simply a rearrangement of equation 1.”
Actually, it is
G + X + I + C = S + T + M + C = GDP
where C stands for consumer spending.
Roger: “It is logical to compare GDP year to year. Equation 2 cannot do this correctly if the units change which is what happens if the money supply changes.”
Equation (2) cannot do that because it covers GDP for a single period of time. There is nothing in it that relates to another period of time. Adding another variable does not do that, either.
@ Min & Roger
Re (2) is a simple rearrangement of (1):
Logically speaking, it isn’t, as a new term, “GDP”, has been added by definition. This is the problem when no differentiation is made between substantive propositions (of which there are two types, primitive propositions and derived propositions) and definitions. The same goes for terms. I am not advocating finitely axiomatizing the framework, which would produce a logical snapshot of the system at a given point in time as I think this would be pointless, but just the introduction of some elementary logical structure, which is not pointless.
Another issue arises with a system of algebraic identities. How do you indicate the causal connections? The equations themselves don’t tell you. It is unreasonable to expect the general reader to figure this out.
Another problem that economists do not presently grapple with effectively. This is the inherent error in a set of figures. In the thirties, for instance, a table of figures were accompanied by error estimates. No longer. To fail to do this in the 21st century is unacceptable and scientifically reprehensible.
@Min
There is nothing in it that relates to another period of time. Adding another variable does not do that, either.
I’m afraid I don’t understand quite what you are saying. A different period of time can be equated to a lag in time, which can be handled by adding a particular subscript to a given variable – same variable, different temporal periods. What is the problem with doing this?
Larry: Min’s first point is that while G + (X – M) + I = S + T is true, it is not GDP. (2) is not a rearrangement of (1) because of this. The rightmost side of (2) should be GDP – C – M.
As I’ve said before, I heartily agree with you that economists over-/mis- use the word “model”, usually obscuring more than clarifying.
There are other problems:
Roger: if the units change which is what happens if the money supply changes.
This does not and cannot happen, by whatever definition one uses of “the money supply changes”, in fact, “The money supply changes” can only mean some quantity changes as measured by one unit taken to be fixed. Whether or not Uncle Sam (or others) print more or shred more dollars during one day or one year, each one is equally usable to cancel one dollar of debt at any time.
This is not an argument that ONLY nominal, monetary units should be used, but an argument that they should be used, along with “real” units like labor hours, to understand a monetary production economy, because they are quite meaningful. Because a monetary production economy is an economy where we have collectively decided to make them (very) meaningful.
One cannot arbitrarily add something not necessarily zero like PB = G-T to one side of a correct(ed) equation, so the manipulations thereafter are not correct. And PB = G-T was already correctly incorporated into the equations. The common, more meaningful adjustment to them is “real GDP”, accounting for inflation, however measured, deflating stuff by multiplying both sides, which can transform an identity to another. Probably some billyblogs talking about real GDP somewhere. But as Bill tells us in manifold ways, the relation of inflation to monetary changes, to things like nonzero “PB” is highly indirect and complicated, unlike a supernaive quantity theory of money. Increasing PB to “pay for” a JG with a sensible, practically possible wage, to eradicate the colossal destruction called unemployment, would essentially never be inflationary, rather the reverse.