It’s Wednesday and I just finished a ‘Conversation’ with the Economics Society of Australia, where I talked about Modern Monetary Theory (MMT) and its application to current policy issues. Some of the questions were excellent and challenging to answer, which is the best way. You can view an edited version of the discussion below and…
Benchmarking macroeconomic theory against reality
I am now using Friday’s blog space to provide draft versions of the Modern Monetary Theory textbook that I am writing with my colleague and friend Randy Wray. We expect to complete the text by the end of this year. Comments are always welcome. Remember this is a textbook aimed at undergraduate students and so the writing will be different from my usual blog free-for-all. Note also that the text I post is just the work I am doing by way of the first draft so the material posted will not represent the complete text. Further it will change once the two of us have edited it. Anyway, this is what I wrote today which was highly constrained by meetings and travel for much of the day.
Note: This Section may be edited down and/or appear elsewhere in the flow of the text.
Chapter 1x – What should a macroeconomic theory be able to explain?
Any macroeconomic theory should help us understand the real world and provide explanations of historical events and reasonable forward-looking outlooks as to what might happen as a consequence of known events – for example, changes in policy settings. A theory doesn’t stand or fall on its absolute predictive accuracy because it is recognised that forecasting errors are a typical outcome of trying to make predictions about the unknown future.
However, systematic forecast errors (that is, continually failing to predict the direction of the economy) and catastrophic oversights (for example, the failure to predict the 2008 Global Financial Crisis) are an indication that a macroeconomic theory is seriously deficient.
In this section we present some stylised facts about the way in which modern industrialised economies have performed over the last several decades. These facts will be referred to throughout the textbook as a reality check when we compare different approaches to the important macroeconomic issues such as unemployment, inflation, interest rates and government deficits.
The facts provide a benchmark against which any macroeconomic theory can be assessed. If a macroeconomic theory generates predictions which are at odds with what we observe then we conclude that it doesn’t advance our understanding of the the real world and should be discarded.
Unemployment
[NOTE: SECTION ON INVOLUNTARY UNEMPLOYMENT TO COME HERE]
Japan
Japan has been the second largest economy since its reconstruction after the Second World War led to spectacular growth in the 1960s. It is now the third largest economy behind the United States and China. The period since 1990 provides a very interesting case study for macroeconomists because it has been marked by some extremes, some of which the rest of the world has encountered since the onset of the Global Financial Crisis.
In the second half of the 1980s, Japan experienced a massive real estate and share market boom, which drove prices up to extraordinary, levels. The “asset price bubble” collapsed in 1989 after the Ministry of Finance substantially increased interest rates to put an end to the inflationary spiral.
Asset prices fell dramatically during the 1990s and the government was forced to use expansionary fiscal policy and near zero interest rates to maintain real economic growth during this period.
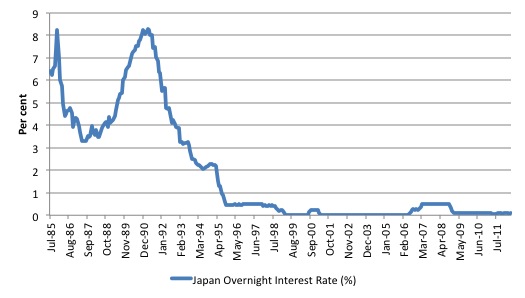
Figure 1a shows the Basic Loan Rate (averaged over the month) for Japan from July 1985 to May 2012 The data is available from the Bank of Japan (http://www.stat-search.boj.or.jp/index_en.html). We will learn in Chapter 14 how the short-term (or overnight) interest rate that the central bank sets in the economy influences the longer-term interest rates (for example, mortgage rates). In general, the lower is the overnight rate, the lower will be all other subsequent rates (which are expressed by their maturity in terms of time).
Figure 1a captures the interest rate hike in the late 1980s as the Government sought to quell the out-of-control asset price bubble and the two decades of near-zero interest rates that followed.
Figure 1a Basic loan rate in Japan, July 1985 to May 2012
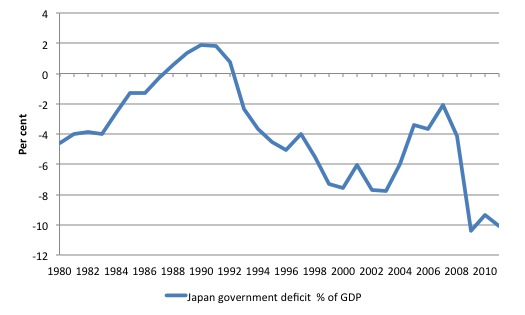
Now consider Figure 1b which shows the evolution of the Japanese government budget deficit as a percentage of GDP since 1980. A budget deficit arises when total revenue taken from the economy by the government sector is less than spending that the government injects into the economy. Figure 1b scales that balance by the size of the economy to put the movements into perspective.
In Chapter 13, where a detailed analysis of fiscal policy is developed you will be exposed to various views about the budget balance. But the orthodox macroeconomic textbooks that are used in undergraduate programs around the world teach students that budget deficits push up interest rates because they require the government to borrow from the private sector and thus compete for scarce funds with other borrowers.
The budget deficit in Japan (as a percent of GDP) has expanded since the early 1990s and in 2011 was 10.1 per cent of GDP having been in surplus in 1992 at the outset of their asset crisis.
Juxtaposing Figures 1a and 1b, it is clear that in a large industrialised nation such as Japan, rising budget deficits do not cause rising interest rates. In general, budget deficits have risen substantially as a percent of GDP in the aftermath of the Global Financial Crisis as governments sought to defend their economies against another Great Depression. Over the same period interest rates have fallen to near zero levels in many nations.
It is clear that orthodox macroeconomics predicts exactly the opposite to what we have observed in the real world. The Global Financial Crisis cannot be dismissed as a special case because we have observed the same patterns in interest rates and budget deficits in Japan, consistently for two decades.
This textbook will develop understandings of the modern monetary system that allows you to explain the two stylised facts. We will learn that the central bank sets the overnight interest rate. We will learn that budget deficits, in fact, place downward rather than upward pressure on interest rates. To understand why that is the case we need to gain a richer understanding of the flow of funds in the monetary system and the role that the central bank plays in managing liquidity in the economy. We also need to learn what drives budget outcomes and the role the government plays in influencing budget deficits or surpluses.
Figure 1b, Government budget deficit as % of GDP, Japan, July 1985 to May 2012
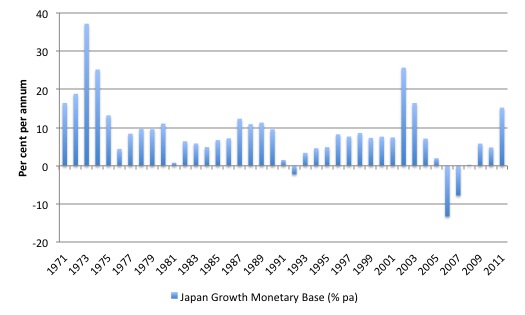
Now consider Figure 1c, which shows the annual growth in the Monetary Base for Japan from 1971 to 2010. The average annual rate of growth over this period was 8.42 per cent. The Monetary Base consists of is sometimes referred to as the money base, high-powered money. In the United Kingdom, the central bank refers to it as narrow money. It consists of notes and coin on issue (held in private bank vaults or circulating in the economy) and bank reserves.
In Chapter 14, we will analyse in detail the relationship that the major private banks (the so-called member banks) have with the central bank. In simple terms, the member banks participate in the clearing house or payments system which involves the daily resolution of all the financial claims between the banks (Cheques). To ensure that financial stability is maintained each of the private banks has to maintain a reserve account at the central bank and debts and credits to these reserves are performed on a daily basis to resolve all the transactions in the economy in a stable manner.
When we talk of bank reserves we are referring to the balances that banks have in these reserve accounts. There is a lot of misunderstanding about the role that the reserve accounts play and Chapter 14 will dispel any doubts about that issue.
The monetary base is thus highly liquid.
In orthodox macroeconomics there is a concept called the money multiplier which asserts that the money supply (which is a broad concept and includes deposits placed in the banking sector and other deposit-like accounts) is a predictable multiple of the monetary base. It is argued within that paradigm that movements in the monetary base drive movements in the money supply.
In turn, an orthodox theory called the Quantity Theory of Money (QTM) draws a relationship between the growth in the money supply and the rate of inflation. This idea is critically examined in Chapters 11 and again in Chapters 13 and 14. Suffice to say the QTM claims that when the money supply rises inflation results. Further, that the rise in the money supply is traced back to central bank decisions to expand the monetary base. So ultimately it is the government that causes inflation.
Relatedly, the orthodox theory argues that if the central bank monetises the budget deficit (they call it “printing money”) then inflation is the result because the monetary base and money supply rises and there is “too much money chasing too few goods”.
These arguments, erroneous as you will see, have been used to make powerful cases against the use of budget deficits and against the central bank purchasing treasury debt.
Figure 1c shows that the growth in the monetary base in Japan since 1970s has been rather strong at various times and the accumulated result of the annual growth has resulted in a monetary base stock that has expanded by 24 times between 2010 and 1970 whereas nominal GDP has expanded around 6 fold over the same period.
Figure 1c Annual growth in Monetary Base, Japan, 1971 to 2010, per cent per annum
Now consider Figure 1d, which shows the annual inflation rate for Japan since 1971 up until April 2011. Like many nations, Japan suffered a substantial burst of inflation in the mid-1970s when the OPEC cartel hiked oil prices and Japan, being an oil-important and dependent industrial nation, suffered what economists refer to as a major supply shock (that is, the raw material costs (oil) rose sharply and pushed up production costs).
The period since the asset bubble burst in the early 1990s has been characterised by very low inflation rates (accompanying the low interest rates) and at times Japan has struggled with periods of deflation (negative inflation).
Figure 1d, Annual Inflation Rate, Japan, 1971 to 2010, per cent per annum
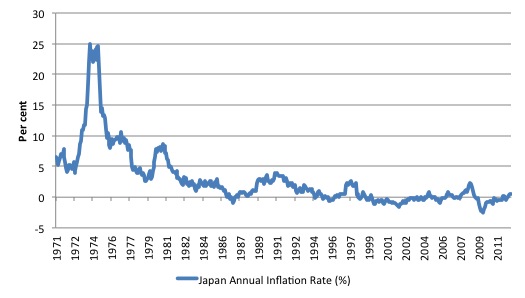
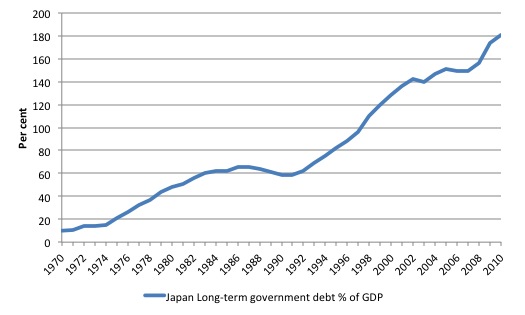
Figure 1e shows the long-term government debt as a percent of GDP over the period 1970 to 2010. It has risen from 10 per cent in 1970s to over 180 per cent in 2010 and the ratio continues to rise. Japan has the largest public debt ratio (long- and short-term debt) of all economies. Many economists and financial commentators have claimed that when the public debt ratio rises above around 80 per cent the nation encounters serious growth constraints and the risk of government insolvency rises to the point that default is inevitable.
The fiscal rules that were imposed in the European Monetary Union (the Eurozone) set a public debt ratio of 60 per cent as the limit that member states should not breach. The orthodox logic is that the debt burden would become so large that eventually, the private investors (the “bond markets”) would judge the nation as being too risky and the government would be unable to borrow any further funds and would become insolvent.
Japan breached the 80 per cent threshold in 1995 as it used budget deficits to support real GDP growth in the face of its major private sector crisis. So it would be a good candidate for insolvency if the orthodox theories were correct.
The reality is that bond markets continually demonstrate their faith in the Japanese government and at each bond tender, when the government seeks to sell new debt, there are always more private investors seeking to purchase the debt than there is debt on offer.
Figure 1e, Long-term government debt as a percent of GDP, Japan, 1971 to 2010, per cent per annum
During the Global Financial Crisis, there has been an unfolding crisis in the Eurozone nations with some nations (for example, Greece and Spain) reaching a point where the private bond markets have refused to buy the government debt at reasonable interest rates. In 2012, Greece defaulted on its debt and a major restructuring was organised by the European Commission in liaison with the European Central Bank and the International Monetary Fund.
Doesn’t this experience confirm that orthodox views that bond markets judge a government by its debt ratio in relation to what is typically considered to be a safe ratio (for example, the 80 per cent threshold)?
The textbook will explain why the Eurozone experience is not representative of the majority of nations. The clue lies in understanding the nature of the monetary system that each country (or in the case of the Eurozone – the union of countries) operates within. We will learn that there is no risk of insolvency in the case of governments that issue their own currency and only ever borrow in that currency, whereas as soon as a nation uses a foreign currency or borrows in a foreign currency the risk of insolvency enters.
Summary
When assessing the statements that financial commentators and economists make in the public debate, one has to continually refer back to these facts.
Some questions that arise from the stylised facts presented in this section include:
1. How did Japan avoid hyperinflation given the growth in its monetary base?
2. How did Japan maintain near zero interest rates for more than two decades even though its budget deficit has risen substantially?
3. How did Japan convince the bond markets to keep buying government debt even though the public debt ratio has risen to over 200 per cent when nations such as Greece and Spain are now being shunned by bond markets but have public debt ratios below 100 per cent?
Data Sources:
The interest rate data is available from the Bank of Japan (http://www.stat-search.boj.or.jp/index_en.html).
The public debt data is available from the Japanese Ministry of Finance (http://www.mof.go.jp/english/budget/statistics/201006/index.html).
The inflation data was compiled using CPI data available from the Reserve Bank of Australia (http://www.rba.gov.au/statistics).
The budget data cam from the IMF World Economic Outlook dataset (http://www.imf.org/weo)
Saturday Quiz
The Saturday Quiz will be back again tomorrow. It will be of an appropriate order of difficulty (-:
That is enough for today!
(c) Copyright 2012 Bill Mitchell. All Rights Reserved.
From the article’s Summary:
I am not sure exactly which “now” the phrase reffers to, but now as in 2011 Greece had a public debt ratio of well above 100%, somewhere around 160% in fact.
“In the second half of the 1980s, Japan experienced a massive real estate and share market boom, which drove prices up to extraordinary, levels.”
You have probably seen this?
“The Plaza Accords of 1985, and the Louvre Accords the following year, obliged Japan’s central bank to lower interest rates and inflate a bubble economy that burst in five years, leaving Japan a financial wreck, unable to challenge America as had been feared by U.S. strategists in the 1980s.”
http://www.soilandhealth.org/03sov/0303critic/030317hudson/superimperialism.pdf
P35
A few suggestions:
=======================
1. “To ensure that financial stability is maintained each of the private banks has to maintain a reserve account at the central bank and debts and credits to these reserves are performed on a daily basis to resolve all the transactions in the economy in a stable manner.”
Sneaky typo. Should read “DEBITS and credits”.
2. I found the jump from discussing bank reserves to discussing the money multiplier a tad confusing. The “bridge sentence” was the following: “The monetary base is thus highly liquid.” Perhaps this could be expanded upon in order to make the transition less jarring.
3. “In 2012, Greece defaulted on its debt…” This should probably read: “In 2012, Greece defaulted on part of its debt…”.
4. “…when nations such as Greece and Spain are now being shunned by bond markets but have public debt ratios below 100 per cent?”
I disagree with some commenters on here that said last week you should avoid contemporary events altogether. I think that its very important to discuss the 2008 crisis and the aftermath in your textbook. However, examples like this are too specific, in my opinion. By the time your book is finished Greece may have exited the euro and Spain may have gotten a bailout. Thus, your example — which would be a good exam question — will already be outdated. To give your book lasting value I think you should refrain from examples as specific as this. Is there a way to make the same point without being so specific? As a previous commenter said above, you’re probably best off NOT using the present tense at all in your textbook.
Sorry if I am being pedantic but your graph of Japan’s deficit (Figure 1b) tells me that it was negative in 2010, i.e. it was a surplus. Don’t you mean the opposite?
I sometimes get confused when you describe the opposition’s case point of view before you own. It would be easier for me if it was the other way around.
Nevertheless, there is a lot of good reading here.
Figure 1B is “Government budget deficit as % of GDP, Japan, July 1985 to May 2012”. A negative deficit would be a surplus. I think the correct label should be “Government budget BALANCE…”
I see Tony beat me to the point by 4 minutes. Guess I need to get quicker with answering the anti-spam math question.
Thanks Bill. When this book is published it will change everything.
“1. How did Japan avoid hyperinflation given the growth in its monetary base?”
I once posed a variation of this question to a prominent fund manager in an attempt to get him to see the error of his assertion that deficits and debt are bad and should be minimized. He replied that the propensity of the Japanese to save at very high rates enabled the government to deficit spend with impunity. His claim was that this would be impossible in other countries where savings rates are not as high. As a result of the wonderful education I’ve received by reading your blog religiously over the last few years I told him that I believed he had the causality backwards and that it was the deficit spending that permitted the Japanese to save as much as they desired, but he didn’t buy it. I suppose in one sense he was correct because if the Japanese desired to save less, they would presumably have consumed more and the same aggregate demand could have been achieved with smaller government deficits. My question here is whether you need to factor the desire to save into your Japanese example and if so, how exactly how you would do so.
So ultimately it is the government that causes inflation.
That’s MMT’s take as well.
As another bit of pedantism, “EMU” officially stands for the Economic and Monetary Union. Though it seems like should stand for European Monetary Union…
Graph 1c shows a 30+% growth in the monetary base in 1973 which seems to correspond to the inflation spike in graph 1d a year or two following. What is the relationship here? Doesn’t this instance confirm the orthadox view that an increase in the monetary base results in inflation?
I don’t actually see any conflict between MMT explanation of Japans high GDP to debt ratio and the mainstream assertion “it is because of the Japanese propensity to save”. The difference is the mainstream don’t seem to understand “the why” of sectoral balance accounting, whereas MMT explains “the why” very elegantly.
The outcome of high Japanese private sector saving is a large Government deficit. They just haven’t yet connected all the dots yet. After the GFC (credit boom and bust) the private sector in most western countries has a higher propensity to save and can support higher deficits and higher debt to GDP ratios.
A theory [in the social sciences?] doesn’t stand or fall on its absolute predictive accuracy because it is recognised that forecasting errors are a typical outcome of trying to make predictions about the unknown future…. The facts provide a benchmark against which any macroeconomic theory can be assessed. If a macroeconomic theory generates predictions which are at odds with what we observe then we conclude that it doesn’t advance our understanding of the the real world and should be discarded.
This is seem to be a bit loose logically. It is amplified by the intervening sentence, However, systematic forecast errors (that is, continually failing to predict the direction of the economy) and catastrophic oversights (for example, the failure to predict the 2008 Global Financial Crisis) are an indication that a macroeconomic theory is seriously deficient.
That’s on the right track, but what are the criteria for assessing this? I think that there could be some criticism forthcoming here for lack of clarity and specificity. This is, after all, a really crucial issue in econ and social science in general. For example, the philosophy of social science is different from the philosophy of the natural sciences due to the different in subject matter calling for different methodological approaches.
While I don’t think you need to spend much ink on this, bare mention seems too cursory to me for such a hot button issue. This is as important as microfoundations v. methodological individualism, at least as I regard it. Even introductory students are going to get these things thrown at them by critics, so they need to be forewarned and prepared for the usual objections.
Students have little if any understanding of HET type issues or the methodology of economics.
Rather than get bogged down in such arguments my opinion is that students should be armed with the mathematical / statistical tools required to slay those raising such questions.
The methodology and philosopy of economics would be best left to the academics.
I have a question. I often hear an objection to your reasoning about Japan, and wonder if it’s true: they say Japan’s bond market is very different from other western capitalistic states, not all are allowed to partecipate to the auctions, so there is no speculation risk, mainly because the bonds are sold to residents (you cannot sell them to everybody, there are restrictions – they say), and when the bonds are hold by residents the risk of default is very low.
So my question is: is it true that the financial system and the bond market in Japan are very different in respect to, for example, the Usa’s ones?