Assume that total employment grew in a particular month in net terms yet unemployment still rose. You also know that the labour force participation rate fell marginally. Taken together this information tells you that
Answer: Labour force growth outstripped employment growth but was less than the growth in the working age population.
The answer is The labour force grew faster than employment but not as fast the working age population.
If you didn't get this correct then it is likely you lack an understanding of the labour force framework which is used by all national statistical offices.
The labour force framework is the foundation for cross-country comparisons of labour market data. The framework is made operational through the International Labour Organization (ILO) and its International Conference of Labour Statisticians (ICLS). These conferences and expert meetings develop the guidelines or norms for implementing the labour force framework and generating the national labour force data.
The rules contained within the labour force framework generally have the following features:
The system of priority rules are applied such that labour force activities take precedence over non-labour force activities and working or having a job (employment) takes precedence over looking for work (unemployment). Also, as with most statistical measurements of activity, employment in the informal sectors, or black-market economy, is outside the scope of activity measures.
Paid activities take precedence over unpaid activities such that for example 'persons who were keeping house' as used in Australia, on an unpaid basis are classified as not in the labour force while those who receive pay for this activity are in the labour force as employed.
Similarly persons who undertake unpaid voluntary work are not in the labour force, even though their activities may be similar to those undertaken by the employed. The category of 'permanently unable to work' as used in Australia also means a classification as not in the labour force even though there is evidence to suggest that increasing 'disability' rates in some countries merely reflect an attempt to disguise the unemployment problem.
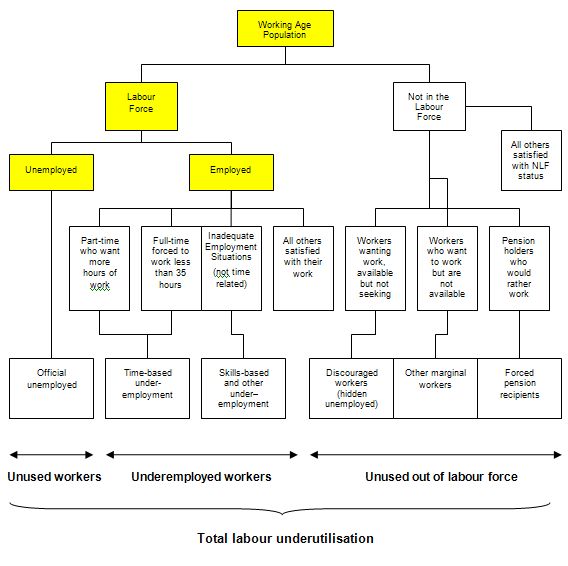
The following diagram shows the complete breakdown of the categories used by the statisticians in this context. The yellow boxes are relevant for this question.
So the Working Age Population (WAP) is usually defined as those persons aged between 15 and 65 years of age or increasing those persons above 15 years of age (recognising that official retirement ages are now being abandoned in many countries).
As you can see from the diagram the WAP is then split into two categories: (a) the Labour Force (LF) and; (b) Not in the Labour Force - and this divisision is based on activity tests (being in paid employed or actively seeking and being willing to work).
The Labour Force Participation Rate is the percentage of the WAP that are active. So if the participation rate is 65 per cent it means that 65 per cent of those persons above the age of 15 are actively engaged in the labour market (either employed or unemployed).
You can also see that the Labour Force is divided into employment and unemployment. Most nations use the standard demarcation rule that if you have worked for one or more hours a week during the survey week you are classified as being employed.
If you are not working but indicate you are actively seeking work and are willing to currently work then you are considered to be unemployed. If you are not working and indicate either you are not actively seeking work or are not willing to work currently then you are considered to be Not in the Labour Force.
So you get the category of hidden unemployed who are willing to work but have given up looking because there are no jobs available. The statistician counts them as being outside the labour force even though they would accept a job immediately if offered.
The question gave you information about employment, unemployment and the labour force participation rate and you had to deduce the rest based on your understanding.
In terms of the Diagram the following formulas link the yellow boxes:
Labour Force = Employment + Unemployment = Labour Force Participation Rate times the Working Age Population
It follows that the Working Age Population is derived as Labour Force divided by the Labour Force Participation Rate (appropriately scaled in percentage point units).
So if both Employment and Unemployment is growing then you can conclude that the Labour Force is growing by the sum of the extra Employment and Unemployment expressed as a percentage of the previous Labour Force.
The Labour Force can grow in one of four ways:
So in our case, if the Participation Rate is falling then the proportion of the Working Age Population that is entering the Labour Force is falling. So for the Labour Force to be growing the Working Age Population has to be growing faster than the Labour Force.
Now consider the following Table which shows the Australian labour force aggregates for January and February 2010 (the same that were used in the question).
So the correct answer is as above.
Of the second option:
The working age population grew faster than employment and offset the decline in the labour force arising from the drop in the participation rate.
Clearly impossible if both employment and unemployment both rose.
And of the third option:
The labour force grew faster than employment but you cannot tell what happened to the working age population from the information provided.
Clearly you can tell what happened to the working age population by deduction.
The following blog may be of further interest to you: