Index of /blog/wp-content/uploads/2011/07
Name
Last modified
Size
Description
Parent Directory
-
us_total_g_gdp_ratio_unemployment_19901_20103-150x150.jpg
2023-02-13 05:27
3.9K
us_total_g_gdp_ratio_unemployment_19901_20103-300x300.jpg
2023-02-13 05:27
11K
us_investment_ratio_ur_2_panel-150x150.jpg
2023-02-13 05:27
4.9K
us_investment_ratio_ur_2_panel-300x160.jpg
2023-02-13 05:27
8.9K
us_inv_ratio_ur_government_spending_1990_2011-150x150.jpg
2023-02-13 05:27
3.8K
us_inv_ratio_ur_government_spending_1990_2011-300x231.jpg
2023-02-13 05:27
9.2K
us_government_spending_ratio_1947_2011-150x150.jpg
2023-02-13 05:27
3.8K
us_government_spending_ratio_1947_2011-300x214.jpg
2023-02-13 05:27
8.7K
us_financial_in_outflows_1975_2010-150x150.jpg
2023-02-13 05:27
5.6K
us_financial_in_outflows_1975_2010-300x172.jpg
2023-02-13 05:27
11K
newcastle_ur-150x150.jpg
2023-02-13 05:27
4.2K
newcastle_ur-300x218.jpg
2023-02-13 05:27
9.2K
newcastle_pr_2007_june_2011-150x150.jpg
2023-02-13 05:27
3.1K
newcastle_pr_2007_june_2011-300x208.jpg
2023-02-13 05:27
6.6K
newcastle_lf_revised_lf_2007_2011-150x150.jpg
2023-02-13 05:27
3.9K
newcastle_lf_revised_lf_2007_2011-300x218.jpg
2023-02-13 05:27
8.5K
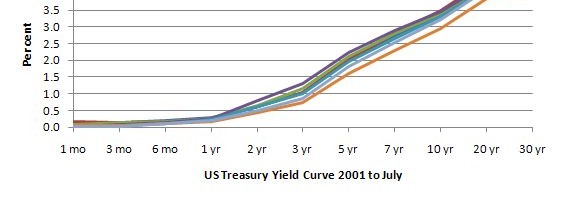
US_yield_curve_July_2011-150x150.jpg
2023-02-13 05:27
5.0K
US_yield_curve_July_2011-300x165.jpg
2023-02-13 05:27
8.8K
US_transition_probabilities_to_Jun_2011-150x150.jpg
2023-02-13 05:27
4.8K
US_transition_probabilities_to_Jun_2011-300x168.jpg
2023-02-13 05:27
10K
US_stupid_SMH_red_ink_graphic-150x150.jpg
2023-02-13 05:27
5.5K
US_stupid_SMH_red_ink_graphic-300x217.jpg
2023-02-13 05:27
13K
US_spending_simulations_2000_2011-150x150.jpg
2023-02-13 05:27
4.0K
US_spending_simulations_2000_2011-300x181.jpg
2023-02-13 05:27
8.9K
US_financial_outflows_1975_2010-150x150.jpg
2023-02-13 05:27
4.8K
US_financial_outflows_1975_2010-300x172.jpg
2023-02-13 05:27
10K
US_financial_inflows_1975_2010-150x150.jpg
2023-02-13 05:27
5.2K
US_financial_inflows_1975_2010-300x180.jpg
2023-02-13 05:27
12K
US_federal_deficit_inflation_1930_2011-150x150.jpg
2023-02-13 05:27
4.2K
US_federal_deficit_inflation_1930_2011-300x180.jpg
2023-02-13 05:27
7.7K
US_failed_leaders_July_7_2011-150x150.jpg
2023-02-13 05:27
6.3K
US_failed_leaders_July_7_2011-300x190.jpg
2023-02-13 05:27
13K
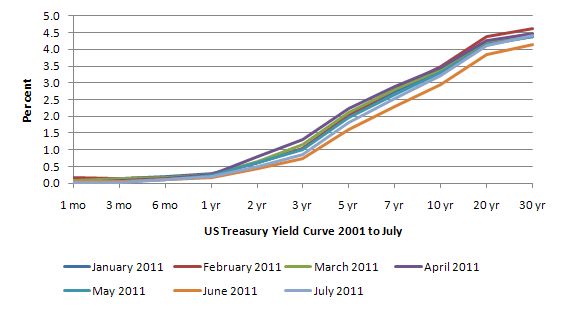
US_bond_yields_Jan_July_2011-150x150.jpg
2023-02-13 05:27
5.9K
US_bond_yields_Jan_July_2011-300x166.jpg
2023-02-13 05:27
11K
US_annual_change_federal_outlays_2000_2011-150x150.jpg
2023-02-13 05:27
4.1K
US_annual_change_federal_outlays_2000_2011-300x181.jpg
2023-02-13 05:27
8.0K
US_UB_pc_Personal_Income_1947_2011-150x150.jpg
2023-02-13 05:27
5.1K
US_UB_pc_Personal_Income_1947_2011-300x182.jpg
2023-02-13 05:27
11K
US_Table_A15_June_2011-150x150.jpg
2023-02-13 05:27
5.5K
US_Table_A15_June_2011-300x90.jpg
2023-02-13 05:27
7.7K
US_GDP_simulated_GDP_2000_2011-150x150.jpg
2023-02-13 05:27
4.3K
US_GDP_simulated_GDP_2000_2011-300x180.jpg
2023-02-13 05:27
10K
US_EU_UE_2007_June_2011-150x150.jpg
2023-02-13 05:27
4.8K
US_EU_UE_2007_June_2011-300x180.jpg
2023-02-13 05:27
11K
US_CLMS_Report_Earnings_indexes_Recovery-150x150.jpg
2023-02-13 05:27
4.2K
US_CLMS_Report_Earnings_indexes_Recovery-300x217.jpg
2023-02-13 05:27
10K
US_Budget_Balance_CBO_automatic_stabilisers-150x150.jpg
2023-02-13 05:27
5.0K
US_Budget_Balance_CBO_automatic_stabilisers-300x187.jpg
2023-02-13 05:27
11K
US_Bloomberg_Budget_graph-150x150.jpg
2023-02-13 05:27
3.8K
US_Bloomberg_Budget_graph-300x173.jpg
2023-02-13 05:27
8.7K
US_Bloomberg_Budget_Graph_Simulated-150x150.jpg
2023-02-13 05:27
6.0K
US_Bloomberg_Budget_Graph_Simulated-300x180.jpg
2023-02-13 05:27
13K
Textbook_Debt_Ratio_Deficit_rises-150x150.jpg
2023-02-13 05:27
3.1K
Textbook_Debt_Ratio_Deficit_rises-300x257.jpg
2023-02-13 05:27
8.3K
Ships_queue_Newcastle-150x150.jpg
2023-02-13 05:27
4.7K
Ships_queue_Newcastle-300x192.jpg
2023-02-13 05:27
11K
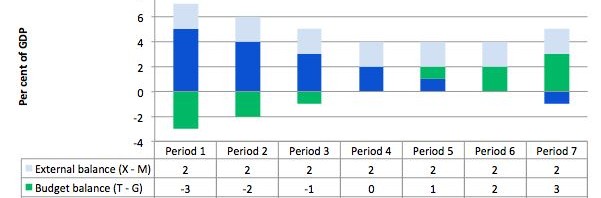
Sectoral_Balances_External_Surplus_Private_Saving_Options-150x150.jpg
2023-02-13 05:27
4.7K
Sectoral_Balances_External_Surplus_Private_Saving_Options-300x121.jpg
2023-02-13 05:27
7.3K
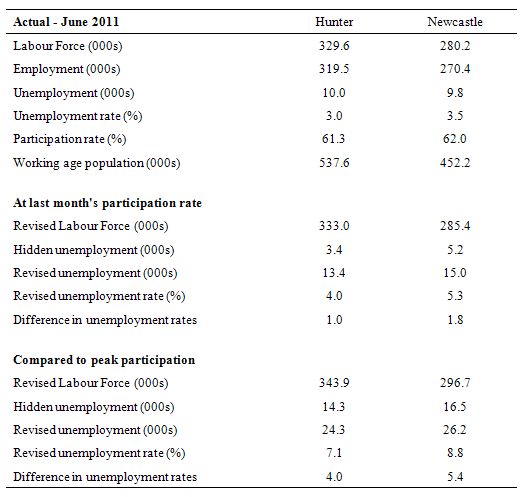
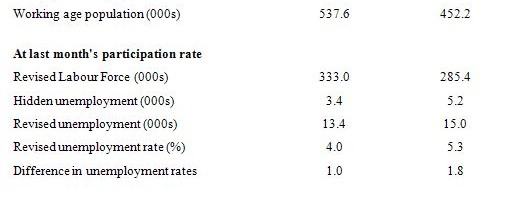
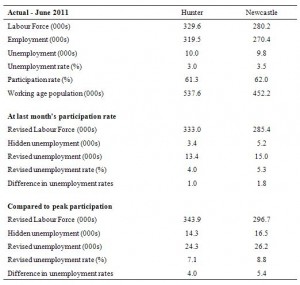
Newcastle_Table_June_2011-150x150.jpg
2023-02-13 05:27
4.5K
Newcastle_Table_June_2011-300x286.jpg
2023-02-13 05:27
15K
Newcastle_LF_Table_May_June_2011-150x147.jpg
2023-02-13 05:27
1.7K
Newcastle_LF_Table_May_June_2011-300x67.jpg
2023-02-13 05:27
3.7K
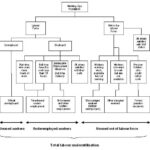
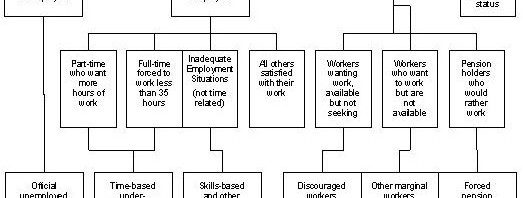
Labour_Force_Framework-150x150.jpg
2023-02-13 05:27
5.2K
Labour_Force_Framework-300x294.jpg
2023-02-13 05:27
16K
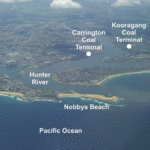
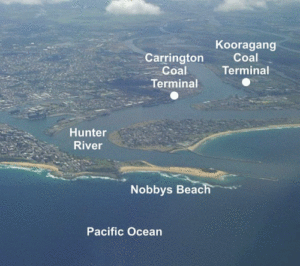
Hunter_Port-150x150.gif
2023-02-13 05:27
17K
Hunter_Port-300x266.gif
2023-02-13 05:27
56K
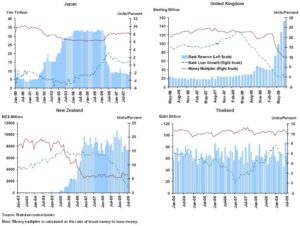
BIS_Money_Multiplier_Credit_Growth-150x150.jpg
2023-02-13 05:27
5.8K
BIS_Money_Multiplier_Credit_Growth-300x226.jpg
2023-02-13 05:27
15K
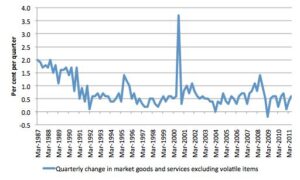
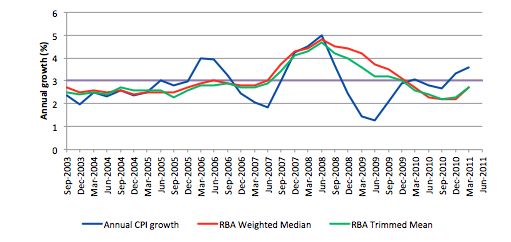
Australian_quarterly_inflation_1987_2011-150x150.jpg
2023-02-13 05:27
5.7K
Australian_quarterly_inflation_1987_2011-300x180.jpg
2023-02-13 05:27
12K
Australia_monthly_growth_hours_worked_and_trend_June_2011-150x150.jpg
2023-02-13 05:27
5.3K
Australia_monthly_growth_hours_worked_and_trend_June_2011-300x225.jpg
2023-02-13 05:27
11K
Australia_labour_force_employment_indexes_gap_Feb_2008_June_2011-150x150.jpg
2023-02-13 05:27
5.3K
Australia_labour_force_employment_indexes_gap_Feb_2008_June_2011-300x183.jpg
2023-02-13 05:27
10K
Australia_indexes_ur_1982_1991_2009_June_2011-150x150.jpg
2023-02-13 05:27
3.6K
Australia_indexes_ur_1982_1991_2009_June_2011-300x216.jpg
2023-02-13 05:27
9.1K
Australia_hours_worked_indexes_Feb_2008_June_2011-150x150.jpg
2023-02-13 05:27
5.4K
Australia_hours_worked_indexes_Feb_2008_June_2011-300x225.jpg
2023-02-13 05:27
13K
Australia_employment_growth_Jun_10_Jun_11-150x150.jpg
2023-02-13 05:27
5.4K
Australia_employment_growth_Jun_10_Jun_11-300x206.jpg
2023-02-13 05:27
12K
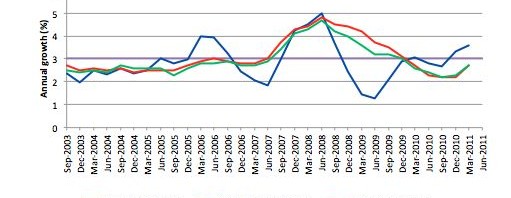
Australia_contributions_inflation_June_2011-150x150.jpg
2023-02-13 05:27
4.6K
Australia_contributions_inflation_June_2011-300x180.jpg
2023-02-13 05:27
7.8K
Australia_changes_employment_by_age_May_2011_June_2011-150x150.jpg
2023-02-13 05:27
6.1K
Australia_changes_employment_by_age_May_2011_June_2011-300x164.jpg
2023-02-13 05:27
11K
Australia_changes_employment_by_age_Feb_2008_June_2011-150x150.jpg
2023-02-13 05:27
5.7K
Australia_changes_employment_by_age_Feb_2008_June_2011-300x169.jpg
2023-02-13 05:27
11K
Australia_changes_employment_by_age_12_months_to_June_2011-150x150.jpg
2023-02-13 05:27
5.4K
Australia_changes_employment_by_age_12_months_to_June_2011-300x164.jpg
2023-02-13 05:27
9.9K
Australia_banana_driven_inflation-150x150.jpg
2023-02-13 05:27
7.5K
Australia_banana_driven_inflation-300x200.jpg
2023-02-13 05:27
17K
Australia_ULP_prices_June_2010_June_2011-150x150.jpg
2023-02-13 05:27
3.7K
Australia_ULP_prices_June_2010_June_2011-300x170.jpg
2023-02-13 05:27
8.1K
Australia_Labour_Demand_UR-150x150.jpg
2023-02-13 05:27
4.4K
Australia_Labour_Demand_UR-300x219.jpg
2023-02-13 05:27
11K
Australia_Inflation_Measures_June_2011-150x150.jpg
2023-02-13 05:27
5.9K
Australia_Inflation_Measures_June_2011-300x142.jpg
2023-02-13 05:27
9.4K
Australia_Economists_Survey_Responses_2011-150x150.jpg
2023-02-13 05:27
2.7K
Australia_Economists_Survey_Responses_2011-300x136.jpg
2023-02-13 05:27
5.9K
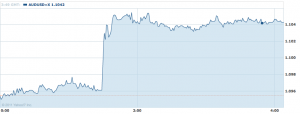
Australia_AUD_effect-768x294.png
2023-02-13 05:27
33K
Australia_AUD_effect-150x150.png
2023-02-13 05:27
4.7K
Australia_AUD_effect-300x115.png
2023-02-13 05:27
9.0K
US_CLMS_Report_Earnings_indexes_Recovery-712x198.jpg
2011-07-29 05:02
14K
US_CLMS_Report_Earnings_indexes_Recovery-300x216.jpg
2011-07-29 05:02
15K
US_CLMS_Report_Earnings_indexes_Recovery.jpg
2011-07-29 05:02
41K
US_federal_deficit_inflation_1930_2011.jpg
2011-07-28 07:32
16K
US_federal_deficit_inflation_1930_2011-482x198.jpg
2011-07-28 07:32
18K
US_spending_simulations_2000_2011.jpg
2011-07-28 06:30
19K
US_spending_simulations_2000_2011-482x198.jpg
2011-07-28 06:30
20K
US_GDP_simulated_GDP_2000_2011-482x198.jpg
2011-07-28 06:13
23K
US_GDP_simulated_GDP_2000_2011.jpg
2011-07-28 06:13
21K
US_annual_change_federal_outlays_2000_2011-483x198.jpg
2011-07-28 06:02
18K
US_annual_change_federal_outlays_2000_2011-300x180.jpg
2011-07-28 06:02
12K
US_annual_change_federal_outlays_2000_2011.jpg
2011-07-28 06:02
16K
US_stupid_SMH_red_ink_graphic-420x198.jpg
2011-07-28 04:59
21K
US_stupid_SMH_red_ink_graphic.jpg
2011-07-28 04:59
24K
Australia_ULP_prices_June_2010_June_2011.jpg
2011-07-27 05:51
20K
Australia_ULP_prices_June_2010_June_2011-512x198.jpg
2011-07-27 05:51
22K
Australia_ULP_prices_June_2010_June_2011-300x169.jpg
2011-07-27 05:51
12K
Australia_contributions_inflation_June_2011.jpg
2011-07-27 05:39
18K
Australia_contributions_inflation_June_2011-512x198.jpg
2011-07-27 05:39
19K
Australia_contributions_inflation_June_2011-300x179.jpg
2011-07-27 05:39
11K
Australian_quarterly_inflation_1987_2011.jpg
2011-07-27 04:54
32K
Australian_quarterly_inflation_1987_2011-512x198.jpg
2011-07-27 04:54
32K
Australian_quarterly_inflation_1987_2011-300x179.jpg
2011-07-27 04:54
18K
Australia_banana_driven_inflation.jpg
2011-07-27 04:27
23K
Australia_banana_driven_inflation-340x198.jpg
2011-07-27 04:27
28K
Australia_AUD_effect-799x198.png
2011-07-27 04:14
14K
Australia_AUD_effect-300x114.png
2011-07-27 04:14
24K
Australia_AUD_effect.png
2011-07-27 04:14
27K
Australia_Inflation_Measures_June_2011.jpg
2011-07-27 01:57
26K
Australia_Inflation_Measures_June_2011-511x198.jpg
2011-07-27 01:57
31K
BIS_Money_Multiplier_Credit_Growth-763x198.jpg
2011-07-25 06:48
38K
BIS_Money_Multiplier_Credit_Growth.jpg
2011-07-25 06:48
74K
Textbook_Debt_Ratio_Deficit_rises-691x198.jpg
2011-07-22 04:13
16K
Textbook_Debt_Ratio_Deficit_rises.jpg
2011-07-22 04:13
32K
Sectoral_Balances_External_Surplus_Private_Saving_Options.jpg
2011-07-22 03:12
21K
Sectoral_Balances_External_Surplus_Private_Saving_Options-601x198.jpg
2011-07-22 03:12
27K
US_yield_curve_July_2011-562x198.jpg
2011-07-21 05:48
24K
US_yield_curve_July_2011.jpg
2011-07-21 05:48
25K
US_bond_yields_Jan_July_2011.jpg
2011-07-21 05:42
35K
US_bond_yields_Jan_July_2011-610x198.jpg
2011-07-21 05:42
32K
Australia_Economists_Survey_Responses_2011.jpg
2011-07-21 04:39
25K
Australia_Economists_Survey_Responses_2011-750x198.jpg
2011-07-21 04:39
22K
Australia_Economists_Survey_Responses_2011-300x135.jpg
2011-07-21 04:39
9.5K
newcastle_lf_revised_lf_2007_2011.jpg
2011-07-14 07:54
28K
newcastle_lf_revised_lf_2007_2011-595x198.jpg
2011-07-14 07:54
22K
newcastle_lf_revised_lf_2007_2011-300x217.jpg
2011-07-14 07:54
12K
newcastle_ur.jpg
2011-07-14 07:54
29K
newcastle_ur-595x198.jpg
2011-07-14 07:54
25K
newcastle_ur-300x217.jpg
2011-07-14 07:54
13K
newcastle_pr_2007_june_2011.jpg
2011-07-14 07:48
22K
newcastle_pr_2007_june_2011-595x198.jpg
2011-07-14 07:48
15K
newcastle_pr_2007_june_2011-300x207.jpg
2011-07-14 07:48
9.9K
Labour_Force_Framework.jpg
2011-07-14 07:35
41K
Labour_Force_Framework-523x198.jpg
2011-07-14 07:35
31K
Labour_Force_Framework-300x293.jpg
2011-07-14 07:35
23K
Newcastle_Table_June_2011.jpg
2011-07-14 07:33
42K
Newcastle_Table_June_2011-522x198.jpg
2011-07-14 07:33
22K
Newcastle_Table_June_2011-300x285.jpg
2011-07-14 07:33
22K
Newcastle_LF_Table_May_June_2011.jpg
2011-07-14 07:14
14K
Hunter_Port.gif
2011-07-14 04:57
141K
Hunter_Port-500x198.gif
2011-07-14 04:57
79K
Ships_queue_Newcastle.jpg
2011-07-14 04:50
41K
Ships_queue_Newcastle-500x198.jpg
2011-07-14 04:50
30K
us_inv_ratio_ur_government_spending_1990_2011.jpg
2011-07-13 07:24
27K
us_inv_ratio_ur_government_spending_1990_2011-547x198.jpg
2011-07-13 07:24
15K
us_government_spending_ratio_1947_2011-566x198.jpg
2011-07-13 07:23
16K
us_government_spending_ratio_1947_2011-300x213.jpg
2011-07-13 07:23
13K
us_government_spending_ratio_1947_2011.jpg
2011-07-13 07:23
29K
Australia_Labour_Demand_UR.jpg
2011-07-13 07:04
28K
Australia_Labour_Demand_UR-525x198.jpg
2011-07-13 07:04
20K
Australia_Labour_Demand_UR-300x218.jpg
2011-07-13 07:04
16K
us_investment_ratio_ur_2_panel.jpg
2011-07-13 06:49
35K
us_investment_ratio_ur_2_panel-720x198.jpg
2011-07-13 06:49
32K
us_total_g_gdp_ratio_unemployment_19901_20103-374x198.jpg
2011-07-13 05:19
13K
us_total_g_gdp_ratio_unemployment_19901_20103.jpg
2011-07-13 05:19
15K
US_Budget_Balance_CBO_automatic_stabilisers.jpg
2011-07-12 09:01
24K
US_Budget_Balance_CBO_automatic_stabilisers-524x198.jpg
2011-07-12 09:01
20K
US_UB_pc_Personal_Income_1947_2011-536x198.jpg
2011-07-12 08:24
26K
US_UB_pc_Personal_Income_1947_2011-300x181.jpg
2011-07-12 08:24
16K
US_UB_pc_Personal_Income_1947_2011.jpg
2011-07-12 08:24
28K
US_Bloomberg_Budget_Graph_Simulated.jpg
2011-07-12 07:53
34K
US_Bloomberg_Budget_Graph_Simulated-544x198.jpg
2011-07-12 07:53
33K
US_Bloomberg_Budget_graph-520x198.jpg
2011-07-12 06:20
17K
US_Bloomberg_Budget_graph-300x172.jpg
2011-07-12 06:20
13K
US_Bloomberg_Budget_graph.jpg
2011-07-12 06:20
19K
US_Table_A15_June_2011.jpg
2011-07-11 07:18
43K
US_Table_A15_June_2011-750x198.jpg
2011-07-11 07:18
55K
US_transition_probabilities_to_Jun_2011.jpg
2011-07-11 06:46
44K
US_transition_probabilities_to_Jun_2011-735x198.jpg
2011-07-11 06:46
29K
US_transition_probabilities_to_Jun_2011-300x167.jpg
2011-07-11 06:46
16K
US_EU_UE_2007_June_2011-482x198.jpg
2011-07-11 06:02
27K
US_EU_UE_2007_June_2011.jpg
2011-07-11 06:02
22K
US_failed_leaders_July_7_2011.jpg
2011-07-11 06:01
34K
US_failed_leaders_July_7_2011-567x198.jpg
2011-07-11 06:01
28K
US_failed_leaders_July_7_2011-300x189.jpg
2011-07-11 06:01
19K
Australia_monthly_growth_hours_worked_and_trend_June_2011.jpg
2011-07-07 05:45
20K
Australia_monthly_growth_hours_worked_and_trend_June_2011-455x198.jpg
2011-07-07 05:45
18K
Australia_hours_worked_indexes_Feb_2008_June_2011.jpg
2011-07-07 05:45
25K
Australia_hours_worked_indexes_Feb_2008_June_2011-456x198.jpg
2011-07-07 05:45
24K
Australia_indexes_ur_1982_1991_2009_June_2011.jpg
2011-07-07 05:29
26K
Australia_indexes_ur_1982_1991_2009_June_2011-520x198.jpg
2011-07-07 05:29
17K
Australia_changes_employment_by_age_Feb_2008_June_2011.jpg
2011-07-07 05:21
32K
Australia_changes_employment_by_age_Feb_2008_June_2011-606x198.jpg
2011-07-07 05:21
23K
Australia_changes_employment_by_age_12_months_to_June_2011.jpg
2011-07-07 05:20
30K
Australia_changes_employment_by_age_12_months_to_June_2011-626x198.jpg
2011-07-07 05:20
21K
Australia_changes_employment_by_age_May_2011_June_2011.jpg
2011-07-07 05:20
32K
Australia_changes_employment_by_age_May_2011_June_2011-626x198.jpg
2011-07-07 05:20
22K
Australia_changes_employment_by_age_May_2011_June_2011-300x163.jpg
2011-07-07 05:20
16K
Australia_labour_force_employment_indexes_gap_Feb_2008_June_2011.jpg
2011-07-07 04:37
27K
Australia_labour_force_employment_indexes_gap_Feb_2008_June_2011-538x198.jpg
2011-07-07 04:37
27K
Australia_labour_force_employment_indexes_gap_Feb_2008_June_2011-300x182.jpg
2011-07-07 04:37
15K
Australia_employment_growth_Jun_10_Jun_11-478x198.jpg
2011-07-07 04:21
25K
Australia_employment_growth_Jun_10_Jun_11-300x205.jpg
2011-07-07 04:21
17K
Australia_employment_growth_Jun_10_Jun_11.jpg
2011-07-07 04:21
23K
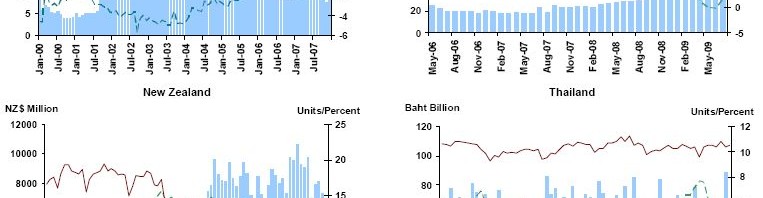
US_financial_inflows_1975_2010.jpg
2011-07-05 07:31
26K
US_financial_inflows_1975_2010-482x198.jpg
2011-07-05 07:31
28K
us_financial_in_outflows_1975_2010.jpg
2011-07-05 07:21
28K
us_financial_in_outflows_1975_2010-505x198.jpg
2011-07-05 07:21
30K
US_financial_outflows_1975_2010.jpg
2011-07-05 07:11
23K
US_financial_outflows_1975_2010-505x198.jpg
2011-07-05 07:11
27K
Apache/2.4.65 (Debian) Server at billmitchell.org Port 443